The Operations dashboard provides data on operational needs to help drive operation management decisions. The dashboard contains both current and historical census data. It also displays attendance data derived from the attendance tracker feature. Use this dashboard to make staffing and location decisions.
Intended Users: Operations Management, Housing Director, Technician, Program Director, Admissions
Prerequisites
- Kipu BI has been enabled in Settings > Instance.
- Kipu BI ETLs are set up and running for the instance.
- The BI Admin has been designated.
- The Dashboard (or dashboards) has been shared with the instance.
- A BI Admin has granted the user permission to view at least one dashboard.
- The instance has been live for at least 30 days and data is present.
Data Refresh Schedule
The data presented in the BI Dashboards is not updated in real time, which means there is a delay between when data is entered into the EMR and when it is viewable in the BI Dashboards. Instead, there are four scheduled BI data refreshes each work day at 3 AM, 9 AM, 1 PM, and 5 PM. There are two scheduled refresh periods on each weekend day at 3 AM and 3 PM. All times are EST.
Note: These BI data refresh periods typically last 4-6 hours and while the refresh process is uploading to the dashboards (usually the last 2 hours of the process) data may not be present or may be incomplete.
Data entered after a refresh will not be reflected in the dashboards until the following refresh is completed. When using the dashboards for analysis it is recommended to use yesterday as the most recent time period to ensure you are working with a complete data set.
Each subtab displays the date and time of the last refresh in UTC.
Operations Dashboard
To begin, click on Reports > Kipu BI > Operations.
General Controls
Below the tabs that include the Operations, Billing, and other options, you will find several icons.
- The circular arrow refreshes the data, while the back and forward arrows undo and redo changes respectively.
- If you click on the icon of a down arrow in a box, you will access the following drop-down list.
- Use the options provided to print the current tab or download it as a PDF file. Clicking View downloads will allow you to view all downloads created from that tab previously, and to download them again.
- Additionally, each widget in the Operations section has options that can be opened by hovering over the empty space at the top right of the widget. The two arrows allow you to expand the widget to full screen, while the three dots allow you to export the data in the widget to a CSV file. You will see these options indicated in many of the following screenshots.

- Use the options provided to print the current tab to or download it as a PDF file. Clicking View downloads will allow you to view all downloads created from that tab previously, and to download them again.
- Hovering over widgets with charts, graphs, and other visual elements will display additional information.
- On all tables, you can adjust the width of a column by hovering over the divider line, then clicking and dragging it to the desired size. Doing so can, in the case of some of the larger tables, help you view more columns at once.
- You can also click on the column title to change whether the column is sorted by alphabetical or reverse alphabetical order.
- Finally, each section has Controls, which have different defaults and purposes. However, the mechanics of each section are similar. To access the controls for each tab, simply click anywhere on the controls row.
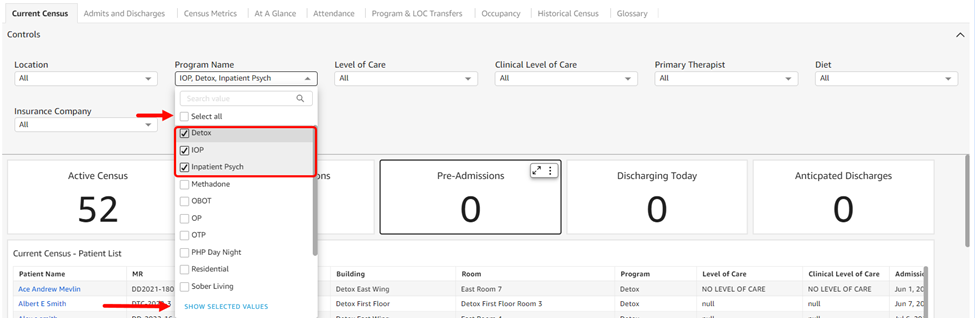
- Most drop-downs contain a series of options and many default to selecting all. You can choose specific items by unchecking the Select All option and then checking off each item individually. If you click the Show Selected Values option at the bottom of the list, you will only see the items you selected.
- The circular arrow refreshes the data, while the back and forward arrows undo and redo changes respectively.
Current Census
-
Controls default to All.
- Location: Location options available are in accordance with the instance itself. They will match the locations found in the instance banner, and are listed alphabetically.
- Program Name: Program options are listed in alphabetical and/or numerical order.
- Level of Care: The level of care options are listed in alphabetical and/or numerical order.
- Clinical Level of Care: The clinical level of care options are listed in alphabetical and/or numerical order.
- Primary Therapist: Primary therapist options are listed in alphabetical and/or numerical order.
- Diet: Diet options are listed in alphabetical and/or numerical order.
- Insurance Company: The insurance company options are listed in alphabetical and/or numerical order.
- Patient Tags: Patient tag options are listed in alphabetical and/or numerical order.
- Active Census: Count of patients in the active census. A patient is considered on the active census when they have an admission date, an MR number, and have yet to be discharged.
- Note: This number might differ from the count displayed on the Patients tab banner. The Patients tab census count includes patients without an MR number recorded. This is because it is including incoming patients in the census count.
- Incoming Admissions: Count of incoming admissions. A patient is considered an Incoming Admission when they have an admission date of today or later, no MR number, and a discharge date that is either blank or a future date.
- Pre-Admissions: Count of pre-admission patients. A patient is considered a pre-admission when they have an MR number but no admission date.
- Discharging Today: Count of in-census patients with a discharge date of today. A patient is considered in census when they have an admission date, an MR number, and have yet to be discharged.
- Anticipating Discharges: Count of in-census patients with an anticipated discharge date of today.
- Patient Name: Combination of the patient’s first, middle, and last name as defined on the patient’s information tab
- MR: Patient’s latest MR number as defined on the patient’s information tab
- Location: Location name as defined in the location profile under Settings Company Location
- Building: Building name as defined in the building profile under Settings Rooms > Building
- Room: Room name as defined in the rooms profile under Settings > Rooms > Room
- Program: Program name as defined on the patient's information tab
- Level of Care: The patient's level of care is found in the patient information tab under "Utilization Review".
- Clinical Level of Care: The patient’s clinical level of care is displayed in the patient header. The Clinical LOC is managed within evaluations that have the field provided (i.e. Manage Clinical Level of Care form).
- Admission Date: The patient’s admission date is found on their information tab
- Anticipated Discharge Date: Date found in the patient’s information tab under ‘Anticipated Discharge Date’
- Discharge Date: The discharge date found on the patient’s information tab
- Days in Census: This is a calculated field that shows the total number of calendar days from the patient's admission date through the current date.

- Current Census by Program: This is a tree map for a count of patients by program, based on the most recent MR number in the patient record. The program names and count totals are displayed in each tile.
- Current Census by Level of Care: This is a tree map for a count of patients by program, based on the most recent MR number in the patient record. The level of care names and count totals are displayed in each tile.
- Current Census by Clinical Level of Care: This is a tree map for a count of patients by clinical level of care based on the most recent MR number in the patient record. Clinical level of care names and count totals are displayed in each title.
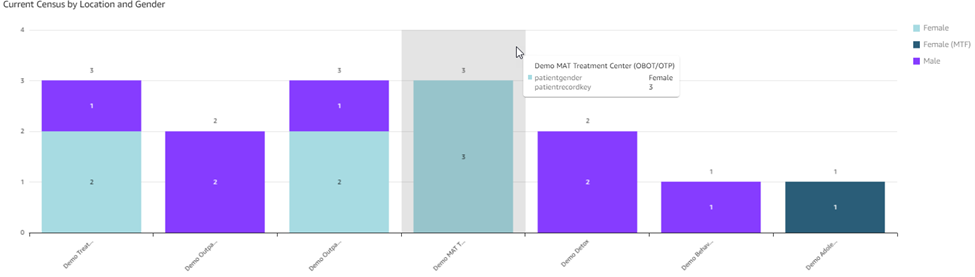

- Current Census by Location and Gender: The stacked bar graph displays the count of records by location and gender in the current census. As you can see, the graph is color-coded by gender.

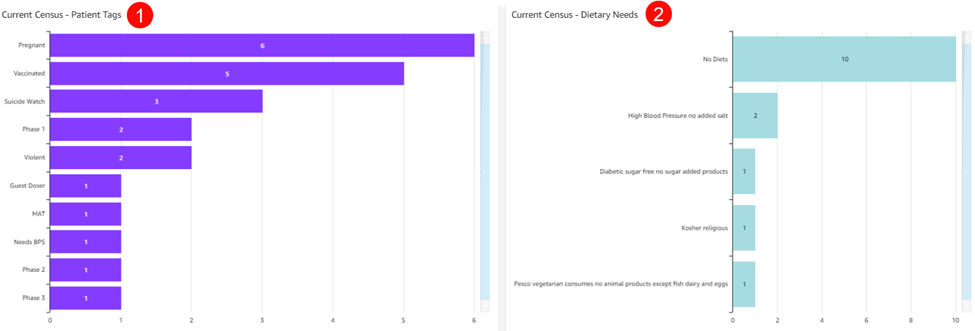
- Current Census - Patient Tags: This graph displays the number of records per patient tag among patients in the current census.
- Current Census - Dietary Needs: This graph shows the count for each diet requirement record among patients in the current census.
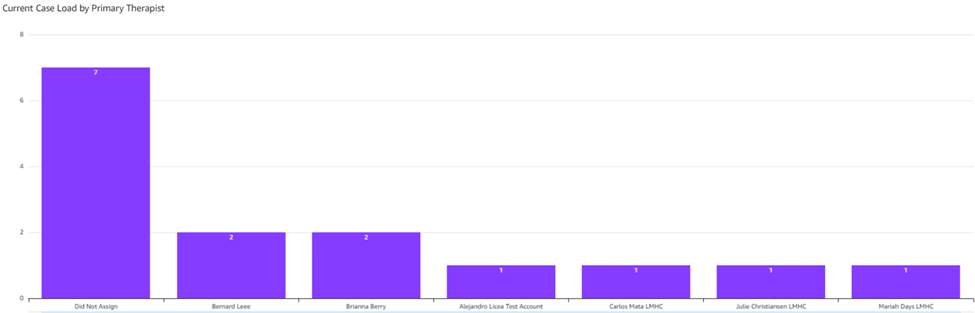

- Current Case Load by Primary Therapist: The graph counts records per primary therapist among patients in the current census.
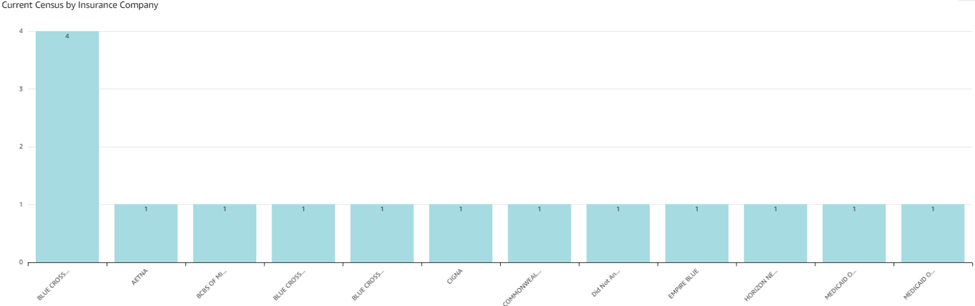

- Current Census by Insurance Company: This graph counts records per primary therapist in the current census.
Admits and Discharges
-
Controls default to All.
- Location: Location options are listed alphabetically and default to all.
- Date: Date is the event date on which either discharge or admission occurred (discharge date or admission date) and is tied to the graph trends and any KPIs labeled as 'Selected Date Range'. The selected date range defaults to the last 13 months.
- Important: Previous year, previous month, and current month KPIs will not update upon modification of the date range because they are hard coded. Additionally, if you enter a manual date range, note that data from the end date will not be included (if you want reports on data from 1/1/2025-1/31/2025 you would enter 1/1/25-2/1/25 and the data from 2/1 won't be included in the report).
- Admissions - Previous Year: Indicates the total number of admissions for the previous year (1/1 - 12/31).
- Admissions - Current Year: Indicates the total number of admissions for the current year (1/1 - today)
- Admissions - Current Month: Indicates the total number of admissions for the current month (first day - today)
- Admissions - Previous Month: Indicates the total number of admissions for the previous month (first day - last day)
- Admissions - Selected Date Range: Indicates the total number of admissions for the selected date range
- Discharges - Previous Year: Indicates the total number of discharges for the previous year (1/1 - 12/31)
- Discharges - Current Year: Indicates the total number of discharges for the current year (1/1 - today)
- Discharges - Current Month: Indicates the total number of discharges for the current month (first day - today)
- Discharges - Previous Month: Indicates the total number of discharges for the previous month (first day - last day)
- Discharges - Selected Date Range: Indicates the total number of discharges for the selected date range

- Admissions vs. Discharges: This graph shows a double line of totals over time for admissions and discharges, and is based on either the admission date or discharge date.
- Admissions - Selected Date Range: This pie chart displays the total admissions for the selected date range broken out by location. Totals and percentages are displayed for each location.
- Discharges - Selected Date Range: This pie chart displays the total discharges for the selected date range broken out by location. Totals and percentages are displayed for each location.
Census Metrics
-
Controls default to All.
- Location: The location options available are in accordance with the instance itself. They will match the locations found in the Kipu EMR instance banner and are listed in alphabetical order and default to All.
- Program: Program options are listed in alphabetical and/or numerical order and default to All.
- Level of Care: The level of care options are listed in alphabetical and/or numerical order and default to All
- Clinical Level of Care: The clinical level of care options are listed in alphabetical and/or numerical order and default to All.
- Insurance Company: Insurance company options are listed in alphabetical and/or numerical order and default to All.
- Include Discharge Date?: Options are No, Yes, and Yes (outpatient only), and default to No.
- Note: Per the American Health Information Management Association (AHIMA) discharge date should not be included when calculating the average daily census due to the Medicare midnight census rule. Each census day begins at 12:00 am and ends at 11:59 pm. If a patient is both admitted and discharged in one census day, they are counted in the daily census.
- Building: The building options are listed in alphabetical and/or numerical order and default to All.
- Census Date: Selected date range defaults to Last 12 months (12 months up to the current date) and is tied to the graph trends and any KPIs labeled as Selected Date Range.
- Important: Previous year, previous month, and current month KPIs will not update upon modification of the date range because they are hard coded. Additionally, if you enter a manual date range, note that data from the end date will not be included (if you want reports on data from 1/1/2025-1/31/2025 you would enter 1/1/25-2/1/25 and the data from 2/1 won't be included in the report).
Note: Per the American Health Information Management Association (AHIMA) discharge date should not be included when calculating the average daily census due to the Medicare midnight census rule. Each census day begins at 12:00 am and ends at 11:59 pm. If a patient is both admitted and discharged in one census day, they are counted in the daily census. This applies to each of the five following widgets.
- Average Daily Census - Previous Year: This is the trending indicator of the average number of patients served daily in the previous year (1/1 -12/31).
- KPI calculation: Sum of the daily census for each day in the reporting period / Total number of days in the reporting period
- Average Daily Census - Current Year: This is the trending indicator of the average number of patients served daily in the current year (1/1 - today).
- KPI calculation: Sum of the daily census for each day in the reporting period / Total number of days in the reporting period
- Average Daily Census - Previous Month: This is the trending indicator of the average number of patients served daily in the previous month (first day - last day).
- KPI calculation: Sum of the daily census for each day in the reporting period / Total number of days in the reporting period
-
Average Daily Census - Current Month: This is the trending indicator of the average number of patients served daily in the current month (first day - today).
-
KPI calculation: Sum of the daily census for each day in the reporting period / Total number of days in the reporting period
-
-
Average Daily Census - Selected Date Range: Trending indicator of the average number of patients served daily in the selected date range
-
KPI calculation: Sum of the daily census for each day in the reporting period / Total number of days in the reporting period.
-

- Census Days - Previous Year: This is the measure of the sum of the daily census totals for each day in the previous year (1/1-12/31).
- Census Days - Current Year: This is the measure of the sum of the daily census totals for each day in the current year (1/1 - today.
- Census Days - Previous Month: This is the measure of the sum of the daily census totals for each day in the previous month (first day - last day).
- Census Days - Current Month: This is the measure of the sum of the daily census totals for each day in the current month (first day - today).
- Census Days - Selected Date Range: This is the measure of the sum of the daily census totals for each day in the selected date range.


- Total Census - Previous Year: Indicates the total number of patients in the previous year (1/1-12/31)
- Total Census - Current Year: Indicates the total number of patients in the current year (1/1 - today)
- Total Census - Previous Month: Indicates the total number of patients in the previous month (first day - last day)
- Total Census - Current Month: Indicates the total number of patients in the current month (first day - today)
- Total Census - Selected Date Range: Indicates the total number of patients in the selected date range
- Census KPIs - Selected Date Range: The bar graph displays census days, total census, and average daily census by month.
- Census Count by Insurance Company - Selected Date Range: The bar graph shows census totals by insurance company over time.
At a Glance
-
Controls default to All.
- Location: Location options available are in accordance with the instance itself. They will match the locations found in the Kipu EMR instance banner, are listed in alphabetical order, and default to All
- Census Date: The date range is tied to the graph trends and any KPIs labeled as 'Selected Date Range'. The selected date range defaults to the current year (1/1 - 12/31).
- Important: Previous year, previous month, and current month KPIs will not update upon modification of the date range because they are hard coded. Additionally, if you enter a manual date range, note that data from the end date will not be included (if you want reports on data from 1/1/2025-1/31/2025 you would enter 1/1/25-2/1/25 and the data from 2/1 won't be included in the report)
- Program Name: Program options are listed in alphabetical and/or numerical order and default to All.
- Level of Care: Level of care options are listed in alphabetical and/or numerical order and default to All.
- Clinical Level of Care: Level of care options are listed in alphabetical and/or numerical order and default to All.
- Insurance Company: Insurance company options are listed in alphabetical and/or numerical order and default to All.

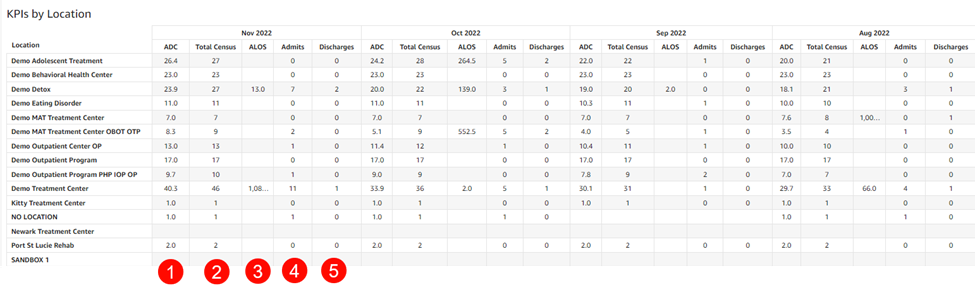
- KPIs by Location: Table of operations KPIs listed for each location and month
-
- Average Daily Census (ADC): The sum of the daily census for each day in the reporting period / Total number of days in the reporting period
- Total Census: The total patient count
- Average Length of Stay (ALOS): Sum of total LOS for discharged patients / Total discharges
- Admits: Total admissions
- Discharges: Total discharges

- KPIs by Location and Program: Table of operations KPIs listed for each location, program, and month
- Average Daily Census (ADC): The sum of the daily census for each day in the reporting period / Total number of days in the reporting period
- Total Census: Total patient count
- Location ALOS: Sum of total average length of stay (ALOS) for discharged patients / Total discharges. If a patient attended multiple locations, the LOS is split between the locations the patient attended.
- Admits: Total admissions
- Discharges: Total discharges
Attendance

-
Controls default to All.
- Location: Location options available are in accordance with the instance itself. They will match the locations found in the Kipu EMR instance banner. The options are listed in alphabetical order and default to All.
- Census Date: Date range is tied to the graph trends and any KPIs labeled as 'Selected Date Range'. The selected date range defaults to ‘This year’ (1/1 - 12/31).
- Note: Previous year, previous month, and current month KPIs will not update upon modification of the date range because they are hard coded. Additionally, if you enter a manual date range, note that data from the end date will not be included (if you want reports on data from 1/1/2025-1/31/2025 you would enter 1/1/25-2/1/25 and the data from 2/1 won't be included in the report).
- Program Name: The program options are listed in alphabetical and/or numerical order and default to All.
- Level of Care: The level of care options are listed in alphabetical and/or numerical order and default to All.
- Clinical Level of Care: Level of care options are listed in alphabetical and/or numerical order and default to All.
- Insurance Company: Insurance company options are listed in alphabetical and/or numerical order and default to All.
- Primary Therapist: Primary therapist options are listed in alphabetical order and default to All.
- Attendance % - Previous Year: Indicates the percentage of attendance recordings marked as present in the previous year (1/1 - 12/31)
- KPI calculation: Total present / (Total present + Total absent)
- Attendance % - Current Year: Indicates the percentage of attendance recordings marked as present in the current year (1/1 - today)
- KPI calculation: Total present / (Total present + Total absent)
- Attendance % - Previous Month: Indicates the percentage of attendance recordings marked as present in the previous month (first day - last day)
- KPI calculation: Total present / (Total present + Total absent)
- Attendance % - Current Month: Indicates the percentage of attendance recordings marked as present in the current month (first day - today)
- KPI calculation: Total present / (Total present + Total absent)
- KPI calculation: Total present / (Total present + Total absent)
- Attendance % - Selected Date Range: Indicates the percentage of attendance recordings marked as present in the selected date range
- KPI calculation: Total present / (Total present + Total absent)
- Attendance % - Selected Date Range: The bar graph shows attendance status totals (absent or present) and percentages by month as well as an attendance percentage trend line.
- Absence Reasons - Selected Date Range: The bar graph shows absent totals by absence reason.
- Attendance by Day: This table displays attendance recordings (present, absent, unrecorded) for each location and day. The subtotals for each attendance recording display at the bottom.
- Attendance by Month: The table displays attendance recordings (present, absent, unrecorded) for each location and month. The subtotals for each attendance recording display at the bottom.
- Attendance by Patient & Program - Patients with no Attendance History Excluded: The table displays patient and program attendance for those patients with attendance history. The dataset excludes patients with no attendance history. The data table contains the following fields:
- Full Name
- MR
- Location
- Admission Date
- Discharge Date
- Program
- Total Present
- Total Absent
-
Attendance % (calculated field)
- Total present / (Total present + Total absent)
- Total Unrecorded
Group Session Attendance
-
Controls default to All
- Location/Location Name: Options are listed in alphabetical order and are available in accordance with the instance itself. They will match the locations found in the Kipu EMR instance banner and default to All. If you select individual locations and then click on Show Selected Values, you will see a list of only the locations you have selected.
- Session Date: The selected date range defaults to the last 13 months and is tied to graph trends, as well as any KPIs labeled as Selected Date Range.
- Important: Previous year, previous month, and current month KPIs will not update upon modification of the date range because they are hardcoded. Additionally, if you enter a manual date range, note that data from the end date will not be included (if you want reports on data from 1/1/2025-1/31/2025 you would enter 1/1/25-2/1/25 and the data from 2/1 won't be included in the report).
- Session Name: Status options are listed in alphabetical order, and the field defaults to All.
- Program/Program Name: Program options are listed in alphabetical and/or numerical order, and default to All.
- Level of Care: UR level of care options are listed in alphabetical order and default to All.
- Clinical Level of Care: Clinical level of care options are listed in alphabetical order and default to All.
- Insurance Company: Insurance company options are listed in alphabetical order and default to All.
- Clinician: Clinician options are listed in alphabetical and/or numerical order and default to All.
- Location/Location Name: Options are listed in alphabetical order and are available in accordance with the instance itself. They will match the locations found in the Kipu EMR instance banner and default to All. If you select individual locations and then click on Show Selected Values, you will see a list of only the locations you have selected.
- Group Sessions Attendance: This chart displays total group session attendance, group session absences, and the group session attendance percentage by month.
- Group Session Attendance by Patient: This table displays attendance recordings (attended, absence, hours, group session attendance %) for each location and day. The subtotals for each attendance recording display at the bottom.
- Group Session Attendance by Clinician: This table displays attendance recordings (attended, absence, hours, group session attendance %) for each location and day. The subtotals for each attendance recording display at the bottom.
- Group Session Attendance by Session Name: This table displays attendance recordings (attended, absence, hours, group session attendance %) for each location and day. The subtotals for each attendance recording display at the bottom.
Billable Days Count
Billable days are census days where a patient has at least one billable item.
-
Controls default to All.
- Census Date: The date range is tied to the graph trends and any KPIs labeled as 'Selected Date Range'. The selection defaults to the last 13 months.
- Program Name: Program options are listed in alphabetical and/or numerical order and default to All.
- Level of Care: Level of care options are listed in alphabetical and/or numerical order and default to All.
- Clinical LOC: Level of care options are listed in alphabetical and/or numerical order and default to All.
- Insurance Company: Insurance company options are listed in alphabetical and/or numerical order and default to All.
- Discharge Type: Discharge type options are listed in alphabetical and/or numerical order and default to All.
- Discharge Date: The patient’s discharge date found on the patient’s information tab
- Patient Name: Combination of the patient’s first, middle, and last name as defined on the patient’s information tab
- Previous Year - Billable Days: Displays the total number of billable days for the previous year
- Current Year - Billable Days: Displays the total number of billable days for the current year to date
- Previous Month - Billable Days: Displays the total number of billable days for the previous calendar month.
- Current Month - Billable Days: Displays the total number of billable days for the current month to date.
- Selected Date Range - Billable Days: Shows the total number of billable days for the selected date range using the Census Date control.
- Billable Days by Month: This chart shows the total number of billable days by month based on discharge date (i.e. if a patient is discharged on October 1st, all their billable days would be included in October, even if all the other billable days occurred in a different month).
- Average Billable Days by Month per Discharged Patient: This chart shows the average number of billable days for each patient discharged each month. As with the Billable Days by Month chart, the all billable days are included in the month of the discharge date, even if most of the billable days occurred in a different month.
- Billable Days Total by Patient: This table shows all billable days organized by patient. Use the + and - icons to expand or collapse data for a better viewing experience. The data table contains the following fields:
- Location
- MR
- Full Name
- Program
- Admission Date
- Discharge Date
- Discharge Type
- Insurance Type
- Billable Days
- Average Billable Days per Patient by Discharge Date - Clinical LOC: This table shows all average billable days grouped by patient. Use the + and - icons to expand or collapse data for a better viewing experience. The data table contains the following fields:
- Location
- Clinical LOC
- Month of Discharge
Program & LOC Transfers
-
Controls default to All.
- Location: Location options available are in accordance with the instance itself. They will match the locations found in the Kipu EMR instance banner. The options are listed in alphabetical order and default to All.
- Census Date: The date range is tied to the graph trends and any KPIs labeled as 'Selected Date Range'. The selection defaults to the last 13 months.
- Program Transfers - Selected Date Range: The stacked bar graph for total transfers is broken out by program each month.
- Program Transfers - Selected Date Range: This bar graph shows transfer totals per program or program transfer sequence (“from” program → “to” program) (i.e. Patient was unassigned and then transferred to PHP).
- Count of Program Transfers - Selected Date Range: This pie chart shows total transfers per program or program transfer sequence (“from” program → “to” program) with the total transfer count displayed in the center of the chart.
- Program Transfers - Selected Date Range: This table shows transfer totals by location and program or program transfer sequence (“from” program → “to” program).
- Level of Care Transfers - Selected Date Range: The bar graph for total transfers shows them broken out by level of care each month.
- Level of Care Transfers - Selected Date Range: The bar graph shows transfer totals per level of care or level of care transfer sequence (“from” LOC → “to” LOC) (i.e. Patient was originally assigned residential and was transferred to IOP).
- Count of LOC Transfers - Selected Date Range: This pie chart shows total transfers per level of care or level of care transfer sequence (“from” LOC → “to” LOC).
- Level of Care Transfers - Selected Date Range: This table shows transfer totals by location and level of care or level of care transfer sequence (“from” LOC → “to” LOC).
Calendar - Appointments
Important
dataset and metrics for Appointments originate from the legacy calendar feature. The dataset is limited to the last 3 years.
-
Controls default to All.
- Appointment Date: Date range is tied to the graph trends and any KPIs labeled as 'Selected Date Range' and defaults to the last 13 months.
- Note: Previous year, previous month, and current month KPIs will not update upon modification of the date range because they are hardcoded. Additionally, if you enter a manual date range, note that data from the end date will not be included (if you want reports on data from 1/1/2025-1/31/2025 you would enter 1/1/25-2/1/25 and the data from 2/1 won't be included in the report).
- Appointment Status (multi-select drop-down with checkboxes): Appointment Status options are listed in alphabetical order and default to All.
- Appointment Type (multi-select drop-down with checkboxes): Appointment Type options are listed in alphabetical order and default to All.
- Patient (multi-select drop-down with checkboxes): Patient options are listed in alphabetical order and default to All.
- Provider (multi-select drop-down with checkboxes): Provider options are listed in alphabetical order and default to All.
- Location (multi-select drop-down with checkboxes): Location options are listed in alphabetical order and are available are in accordance with the instance itself. They will match the locations found in the Kipu EMR instance banner and default to All.
- Program (multi-select drop-down with checkboxes): Program options are listed in alphabetical and/or numerical order and default to All.
- Level of Care (multi-select drop-down with checkboxes): Level of care options listed in alphabetical and/or numerical order and default to All.
- Clinical Level of Care (multi-select drop-down with checkboxes): Clinical level of care options listed in alphabetical and/or numerical order and default to All.
- Telehealth? (multi-select drop-down with checkboxes): Select Yes or No, otherwise it defaults to All.
- Appointment Date: Date range is tied to the graph trends and any KPIs labeled as 'Selected Date Range' and defaults to the last 13 months.
- Cancellation Rate - Previous Year: Indicates the percentage of canceled appointments in the previous year (1/1 - 12/31). Includes the Canceled Scheduler appointment status and any customized appointment status containing the following: cancel, cancellation, and cancelled.
-
KPI calculation: Total Canceled Appointments / Total Appointments
-
- Cancellation Rate - Current Year: Indicates the percentage of canceled appointments in the current year (1/1 - today). Includes the Canceled Scheduler appointment status and any customized appointment status containing the following: cancel, cancellation, and cancelled.
-
KPI calculation: Total Canceled Appointments / Total Appointments
-
- Cancellation Rate - Previous Month: Indicates the percentage of canceled appointments in the previous month (first day - last day). Includes the Canceled Scheduler appointment status and any customized appointment status containing the following: cancel, cancellation, and cancelled.
- KPI calculation: Total Canceled Appointme nts / Total Appointments
- Cancellation Rate - Current Month: Indicates the percentage of canceled appointments in the current month (first day - today). Includes the Canceled Scheduler appointment status and any customized appointment status containing the following: cancel, cancellation, and cancelled.
-
KPI calculation: Total Canceled Appointments / Total Appointments
-
- Cancellation Rate - Selected Date Range: Indicates the percentage of canceled appointments in the selected date range. Includes the No Show Scheduler appointment status and any customized appointment status containing the following: no show, no show/cancelled, absent, AMA, attempted to call, did not attend, left message, left voicemail, no answer, not available, out of town, refused, no call, and unexcused.
-
KPI calculation: Total Canceled Appointments / Total Appointments
-
- No Show Rate - Previous Year: Indicates the percentage of canceled appointments in the previous year (1/1 - 12/31). Includes the No Show Scheduler appointment status and any customized appointment status containing the following: no show, no show/cancelled, absent, AMA, attempted to call, did not attend, left message, left voicemail, no answer, not available, out of town, refused, no call, and unexcused.
-
KPI calculation: Total No Show Appointments / Total Appointments
-
- No Show Rate - Current Year: Indicates the percentage of canceled appointments in the current year (1/1 - today). Includes the No Show Scheduler appointment status and any customized appointment status containing the following: no show, no show/cancelled, absent, AMA, attempted to call, did not attend, left message, left voicemail, no answer, not available, out of town, refused, no call, and unexcused.
- KPI calculation: Total No Show Appointments / Total Appointments
- No Show Rate - Previous Month: KPI calculation: Total No Show Appointments / Total Appointments. Includes the No Show Scheduler appointment status and any customized appointment status containing the following: no show, no show/cancelled, absent, AMA, attempted to call, did not attend, left message, left voicemail, no answer, not available, out of town, refused, no call, and unexcused.
-
KPI calculation: Total No Show Appointments / Total Appointments
-
- No Show Rate - Current Month: Indicates the percentage of canceled appointments in the current month (first day - today). Includes the No Show Scheduler appointment status and any customized appointment status containing the following: no show, no show/cancelled, absent, AMA, attempted to call, did not attend, left message, left voicemail, no answer, not available, out of town, refused, no call, and unexcused.
-
KPI calculation: Total No Show Appointments / Total Appointments
-
- No Show Rate - Selected Date Range: Indicates the percentage of no show appointments in the selected date range. Includes the No Show Scheduler appointment status and any customized appointment status containing the following: no show, no show/cancelled, absent, AMA, attempted to call, did not attend, left message, left voicemail, no answer, not available, out of town, refused, no call, and unexcused.
- KPI calculation: Total No Show Appointments / Total Appointments
- Appointments- Selected Date Range: This stacked bar graph displays appointment totals by appointment status, cancellation rate, and no show rate by month. The appointment statuses are color coded, as are the cancellation rate line and no show rate line, which also display with value.
- Appointment Status - Selected Date Range: Donut graph for total appointments per appointment type. The appointment types are color coded, totals and percent of total appointments display when hovered over, and the total appointment count appears in the middle.
- Appointment Type - Selected Date Range: Donut graph for total appointments per appointment type. The appointment types are color coded, totals and percent of total appointments display when hovered over, and the total appointment count appears in the middle.
- Telehealth Appointment - Selected Date Range: Donut graph for total Telehealth or non-Telehealth appointment. Yes will display for Telehealth appointments, no for non-Telehealth appointments, the totals and precents will display when overed over, and the total appointment count appears in the middle.
- Appointment Status by Location - Selected Date Range: Horizontal stacked bar graph for appointment status by location. The appointment statuses are color coded.
- Appointment Type by Location - Selected Date Range: Horizontal stacked bar graph for appointment type by location. The appointment types are color coded.
- Appointment Status by Provider - Selected Date Range: Horizontal stacked bar graph for appointment status by provider. Appointment statuses are color coded.
-
Appointment Type by Provider - Selected Date Range: Horizontal stacked bar graph for appointment type by provider. Appointment types are color coded.
- Calendar - Appointments Data Table: The data table contains the following fields:
- Location: The name of the location
- Patient: The patient's full name
- MR: The patient's MR number
- Provider: The name of the patient's provider
- Appointment Date: The date the appointment took place
- Appointment Type: The appointment type
- Appointment Status: Indicates the appointment's status
- Program: The program in which the patient is enrolled
- Level of Care (LOC): The patient's level of care
- Telehealth?: Indicates whether or not the appointment was Telehealth
- Clinical Level of Care (LOC): The patient's clinical level of care
- Duration: The difference between the appointment start and end time
- Cancelled Appointment: Whether or not the appointment was canceled
Scheduler - Appointments
-
Controls default to All.
- Appointment Date: Date range is tied to the graph trends and any KPIs labeled as 'Selected Date Range' and defaults to the last 13 months.
- Note: Previous year, previous month, and current month KPIs will not update upon modification of the date range because they are hardcoded. Additionally, if you enter a manual date range, note that data from the end date will not be included (if you want reports on data from 1/1/2025-1/31/2025 you would enter 1/1/25-2/1/25 and the data from 2/1 won't be included in the report).
- Appointment Status (multi-select drop-down with checkboxes): Appointment Status options are listed in alphabetical order and default to All.
- Appointment Type (multi-select drop-down with checkboxes): Appointment Type options are listed in alphabetical order and default to All.
- Patient (multi-select drop-down with checkboxes): Patient options are listed in alphabetical order and default to All.
- Provider (multi-select drop-down with checkboxes): Provider options are listed in alphabetical order and default to All.
- Location (multi-select drop-down with checkboxes): Location options are listed in alphabetical order and are available are in accordance with the instance itself. They will match the locations found in the Kipu EMR instance banner and default to All.
- Program (multi-select drop-down with checkboxes): Program options are listed in alphabetical and/or numerical order and default to All.
- Level of Care (multi-select drop-down with checkboxes): Level of care options listed in alphabetical and/or numerical order and default to All.
- Clinical Level of Care (multi-select drop-down with checkboxes): Clinical level of care options listed in alphabetical and/or numerical order and default to All.
- Telehealth? (multi-select drop-down with checkboxes): Select Yes or No, otherwise it defaults to All.
- Appointment Classification: Choose Select All, Patient, Non Patient, or Group Session, otherwise it defaults to All.
- Appointment Date: Date range is tied to the graph trends and any KPIs labeled as 'Selected Date Range' and defaults to the last 13 months.
- Cancellation Rate - Previous Year: Indicates the percentage of canceled appointments in the previous year (1/1 - 12/31). Includes the Canceled Scheduler appointment status.
-
KPI calculation: Total Canceled Appointments / Total Appointments
-
- Cancellation Rate - Current Year: Indicates the percentage of canceled appointments in the current year (1/1 - today). Includes the Canceled Scheduler appointment status.
-
KPI calculation: Total Canceled Appointments / Total Appointments
-
- Cancellation Rate - Previous Month: Indicates the percentage of canceled appointments in the previous month (first day - last day). Includes the Canceled Scheduler appointment status.
- KPI calculation: Total Canceled Appointments / Total Appointments
- Cancellation Rate - Current Month: Indicates the percentage of canceled appointments in the current month (first day - today). Includes the Canceled Scheduler appointment status.
-
KPI calculation: Total Canceled Appointments / Total Appointments
-
- Cancellation Rate - Selected Date Range: Indicates the percentage of canceled appointments in the selected date range.
-
KPI calculation: Total Canceled Appointments / Total Appointments
-
- No Show Rate - Previous Year: Indicates the percentage of canceled appointments in the previous year (1/1 - 12/31). Includes the No Show Scheduler appointment status.
-
KPI calculation: Total No Show Appointments / Total Appointments
-
- No Show Rate - Current Year: Indicates the percentage of canceled appointments in the current year (1/1 - today). Includes the No Show Scheduler appointment status.
- KPI calculation: Total No Show Appointments / Total Appointments
- No Show Rate - Previous Month: KPI calculation: Total No Show Appointments / Total Appointments. Includes the No Show Scheduler appointment status.
-
KPI calculation: Total No Show Appointments / Total Appointments
-
- No Show Rate - Current Month: Indicates the percentage of canceled appointments in the current month (first day - today). Includes the No Show Scheduler appointment status.
-
KPI calculation: Total No Show Appointments / Total Appointments
-
- No Show Rate - Selected Date Range: Indicates the percentage of no show appointments in the selected date range. Includes the No Show Scheduler appointment status.
- KPI calculation: Total No Show Appointments / Total Appointments
- Appointments - Selected Date Range: This stacked bar graph displays appointment totals by appointment status, cancellation rate, and no show rate by month. The appointment statuses are color coded, as are the cancellation rate line and no show rate line, which also display with value.
- Appointment Status - Selected Date Range: Donut graph for total appointments per appointment type. The appointment types are color coded, totals and percent of total appointments display when hovered over, and the total appointment count appears in the middle.
- Appointment Type - Selected Date Range: Donut graph for total appointments per appointment type. The appointment types are color coded, totals and percent of total appointments display when hovered over, and the total appointment count appears in the middle.
- Appointment Classification - Selected Date Range: Donut graph for total appointments per classification. The appointment classifications are color coded, totals and percent of total appointments display when hovered over, and the total appointment count appears in the middle.
- Telehealth Appointment - Selected Date Range: Donut graph for total Telehealth or non-Telehealth appointment. Yes will display for Telehealth appointments, no for non-Telehealth appointments, the totals and precents will display when overed over, and the total appointment count appears in the middle.
- Cancellation Reasons - Selected Date Range: Stacked bar graph for canceled appointment totals by cancellation reason by month. Cancellation reasons are color coded.
- Cancellation Entity (null excluded) - Selected Date Range: Donut graph for canceled appointments per cancellation entity. Cancellation entities (the parties responsible for cancellation) are color coded and the totals and percentages of cancelled appointments appear when overed over. The total number of cancelled appointments appears in the middle.
- Appointment Status by Location - Selected Date Range: Horizontal stacked bar graph for appointment status by location. The appointment statuses are color coded.
- Appointment Type by Location - Selected Date Range: Horizontal stacked bar graph for appointment type by location. The appointment types are color coded.
- Appointment Status by Provider - Selected Date Range: Horizontal stacked bar graph for appointment status by provider. Appointment statuses are color coded.
-
Appointment Type by Provider - Selected Date Range: Horizontal stacked bar graph for appointment type by provider. Appointment types are color coded.
- Current Census Patients with No Appointments: This data table contains information about patients currently in the active census who have no scheduled appointments.
- Location
- MR
- Patient
- Program
- LOC
- Clinical LOC
- Next Appointment
- Last Appointment
- Days since Last Appointment
- Appointments Data Table
- Location: The name of the location
- Patient Full Name: The patient's full name
- MR: The patient's MR number
- Provider: The name of the patient's provider
- Appointment Date: The date the appointment took place
- Appointment Type: The appointment type
- Appointment Classification: The appointment classification (Patient, Non Patient, Group Session)
- Appointment Status: Indicates the appointment's status
- Program: The program in which the patient is enrolled
- Level of Care (LOC): The patient's level of care
- Telehealth?: Indicates whether or not the appointment was Telehealth
- Clinical Level of Care (LOC): The patient's clinical level of care
- Duration: The difference between the appointment start and end time
- Cancelled Appointment: Whether or not the appointment was canceled
- Deleted Appointment Filters: These filters are intended to be used on the patient and provider deleted appointments tables.
- Appointment Date
- Deleted Date
- User
- Patient was Deleted Appointment - Deleted Table: This data table contains patient level deleted appointments and contains the following fields:
- Location
- Patient
- Full Name
- MR
- Provider Name
- Appointment Date
- Appointment Type
- Program LOC
- Clinical LOC
- Created Date
- Deleted Date
- Deletion Type
- User
- Duration
- Telehealth Session
- Provider Deleted Appointments Table: This data table contains provider level deleted appointments and contains the following fields:
- Location
- Provider Name
- Appointment Date
- Appointment Type
- Created Date
- Deleted Date
- Deletion Type
- User
- Duration
-
Telehealth Session
Rounds
-
Controls default to All.
- Location: Location options available are in accordance with the instance itself. They will match the locations found in the Kipu EMR instance banner. Location options are listed in alphabetical order and default to All.
- Building Name: The building options are listed in alphabetical and/or numerical order and default to All.
- Round Date: Choose relative dates or an absolute date range. Additionally, if you enter a manual date range, note that data from the end date will not be included (if you want reports on data from 1/1/2025-1/31/2025 you would enter 1/1/25-2/1/25 and the data from 2/1 won't be included in the report).
- Round Observation State: Choose to filter by status.
- Observation Signed By: Filter results by the user who signed off on the round.
Round Observations
- Rounds Observations by Location: This table shows the following data points for rounds by location and month.
- Complete Total: Total number of completed rounds at the given location for the given month.
- Complete %: The percentage of rounds in the Completed status at the given location for the given month.
- In-Progress Total: The total number of in-progress rounds at the given location for the given month.
- In-Progress %: The percentage of rounds in the In-Progress status at the given location for the given month.
- Reviewed Total: The total number of reviewed rounds at the given location for the given month.
- Reviewed %: The percentage of rounds in the In-Progress status at the given location for the given month.
- Total: The total number of rounds in any status at the given location
- Rounds Observations by Building: This table shows the following data points for rounds by building and month.
- Complete Total: Total number of completed rounds at the given building for the given month.
- Complete %: The percentage of rounds in the Completed status at the given building for the given month.
- In-Progress Total: The total number of in-progress rounds at the given building for the given month.
- In-Progress %: The percentage of rounds in the In-Progress status at the given building for the given month.
- Reviewed Total: The total number of reviewed rounds at the given building for the given month.
- Reviewed %: The percentage of rounds in the In-Progress status at the given building for the given month.
- Total: The total number of rounds in any status at the given building
- Rounds Observations by Round Title: This table shows the following information for rounds by round name, month, and status.
- Complete Total: Total number of times a round of that name was completed for the given month.
- Complete %: The percentage of rounds of that name in the Completed status for the given month.
- In-Progress Total: The total number of in-progress rounds of the given name for the given month.
- In-Progress %: The percentage of rounds of that name in the In-Progress status for the given month.
- Reviewed Total: The total number of reviewed rounds of the given name for the given month.
- Reviewed %: The percentage of rounds of that name in the In-Progress status for the given month.
- Total: The total number of times the round of that name was completed
- Rounds Observations Table: This table shows the following round observation information.
- Location: The name of the location where the round was observed
- Round Title: The name of the round
- Round Date: The date on which the round occurred
- Round Competed At: The time when the round was completed
- Round Observation Status: Displays the round's status (options are complete, in-progress, and reviewed)
- Round Signed By: The name of the staff member who signed off on the round
- Round Signed At: The time at which the round was signed
- Round Reviewed At: The time at which the round was reviewed
Patient Observations
- Patient Round Observations by Location: This table contains the following data points for round observations by location and by month.
- Present Count: The total number of patients marked as present in the given month
- Present %: The percentage of patients marked as present out of the total number
- Missing Count: The total number of patients marked as absent in the given month
- Missing %: The percentage of patients marked as absent out of the total number
- Total Count: The total number of patients marked as present and absent across all months
- Total %: The total percentage of all present and missing patients (this number will always be 100%)
- Patient Round Observations by Building: This table includes the following data points for round observations for each building in a location by month.
- Present Count: The total number of patients marked as present in the given month
- Present %: The percentage of patients marked as present out of the total number
- Missing Count: The total number of patients marked as absent in the given month
- Missing %: The percentage of patients marked as absent out of the total number
- Total Count: The total number of patients marked as present and absent across all months
- Total %: The total percentage of all present and missing patients (this number will always be 100%)
- Patient Round Observation Summary: This table includes the following data points for round observations by patient.
- Patient: The patient's name
- MR: The patient's MR number
- Location: The name of the location
- Building: The name of the building
- Bed: The bed number
- Round Date: The date the round occurred
- Patient Observations: Any observations about the patient added to the round by the observer
- Program: The name of the program in which the patient is enrolled
- LOC: The patient's level of care
- Count: Number of rounds in which the patient has been included
- Missing: The number of rounds for which the patient was absent (note that this field will only appear once patients have been marked as missing)
- Patient Round Observations Table: This table shows the following information.
- Patient: Full name of the patient
- MR: The patient's MR number
- Location: The name of the location
- Building: The name of the building
- Bed: The bed number
- Patient Observed At: The date the patient was observed
- Patient Observed By: The name of the staff member who observed the round
Occupancy
-
Controls default to All.
- Location: Location options available are in accordance with the instance itself. They will match the locations found in the Kipu EMR instance banner. Location options are listed in alphabetical order and default to All.
- Building: Building options available are in accordance with the instance itself. They will match the locations found in the Kipu EMR instance banner. Building options are listed in alphabetical order and default to All.

- Total Beds: Total beds in a given location, program, or level of care
- Occupied Beds: Total beds occupied
- Available Beds: Total vacant beds
- Occupancy %: Indicates the capacity percentage for a given location, program, or level of care
- Available Beds vs Occupied Beds by Location: The bar displays the count of available vs occupied beds per location and includes the capacity/occupancy percent line.
- Available Beds vs Occupied Beds by Building: The graph displays the count of available vs. occupied beds per building and shows the capacity/occupancy percent line.
- Bed Board - Current Census: Data table displays the following fields:
- Full Name: The patient name is hyperlinked and will take you straight to the patient chart when selected
- MR: Patient’s latest MR number as defined on the patient’s information tab
- Location: Location name as defined in the location profile under Settings Company Location
- Building Name: Building name as defined in the building profile under Settings > Rooms > Building
- Room Name: Room name as defined in the Rooms profile under Settings > Rooms > Room
- Bed Name: Bed name as defined in the beds profile under Settings > Rooms > Bed
- Gender: The birth sex of the patient defined on the patient’s information tab
- Gender Identity: The gender the patient identifies as defined on the patient’s information tab if the gender identity setting is enabled
- Admission Date: The patient’s admission date found on the patient’s information tab
- Anticipated Discharge Date: Date found in the patient’s information tab under ‘Anticipated Discharge Date’
- Discharge Date: The patient’s discharge date found on the patient’s information tab
Census Snapshot
-
Controls default to All.
- Census Date: The selected date range defaults to the last 13 months and is tied to the graph trends and any KPIs labeled as 'Selected Date Range'.
- Note: Previous year, previous month, and current month KPIs will not update upon modification of the date range because they are hard coded. Additionally, if you enter a manual date range, note that data from the end date will not be included (if you want reports on data from 1/1/2025-1/31/2025 you would enter 1/1/25-2/1/25 and the data from 2/1 won't be included in the report).
- Location: Location options are listed in alphabetical order in accordance with the instance itself. They will match the locations found in the Kipu EMR instance banner and default to All.
- Program: Program options are listed in alphabetical and/or numerical order and default to All.
- Level of Care: Level of care options are listed in alphabetical and/or numerical order and default to All.
- Clinical Level of Care: Level of care options are listed in alphabetical and/or numerical order and default to All.
- Insurance Company: Insurance company options are listed in alphabetical and/or numerical order and default to All.
- Patient: Patient name options are listed in alphabetical order by first name and default to All.
- Discharge Type: Discharge type options are listed in alphabetical and/or numerical order and default to All.
- Census Date: The selected date range defaults to the last 13 months and is tied to the graph trends and any KPIs labeled as 'Selected Date Range'.
- Census Count on Date Selected: A patient is considered in census when they have an admission date, an MR number, and have yet to discharge as of the date selected.

- Census on Date Selected - Patient List
- Patient: Combination of the patient’s first, middle, and last name as defined on the patient’s information tab
- MR: Patient’s latest MR number as defined on the patient’s information tab
- Location: Location name as defined in the location profile under Settings > Company > Location
- Building Name: Building name as defined in the building profile under Settings > Rooms > Building
- Bed: Bed name as defined in the beds profile under Settings > Rooms > Bed.
- Program: Program name as defined on the patient’s information tab
- Level of Care: Displays the patient's UR level of care, which can be found in the patient’s information tab under Utilization Review.
- Clinical Level of Care: The patient’s clinical level of care as displayed in the patient header. The Clinical LOC is managed within evaluations that have the field provided (i.e. Manage Clinical Level of Care form)
- Admission Date: The patient’s admission date found on the patient’s information tab
- Anticipated Discharge Date: The date found in the patient’s information tab under Anticipated Discharge Date.
- Discharge Date: The patient’s discharge date found on the patient’s information tab
- Census on Date Selected by Program: The count is based on the most recent MR number in the patient record and program names. Count totals are displayed in each tile.
- Census on Date Selected by Level of Care: The count is based on the most recent MR number in the patient record and program names. Count totals are displayed in each tile.
- Census on Date Selected by Clinical Level of Care: The count is based on the most recent MR number in the patient record and program names. count totals are displayed in each tile.
- Census on Date Selected by Location and Gender: A stacked bar graph for a count of records by location and gender for the census on the selected date.
- Census on Date Selected by Primary Therapist: The Current Case Load by Primary Therapist on the selected date.
- Census on Date Selected by Insurance Company: The count of records per insurance company based on the date selected.
Historic Census
-
Controls default to All.
- Location: Location options available are in accordance with the instance itself. They will match the locations found in the Kipu EMR instance banner. Location options are listed in alphabetical order and default to All.
- Census Date: The date range is tied to the graph trends and any KPIs labeled as 'Selected Date Range'. The selected date range defaults to the last 13 months.
- Note: Previous year, previous month, and current month KPIs will not update upon modification of the date range because they are hard coded. Additionally, if you enter a manual date range, note that data from the end date will not be included (if you want reports on data from 1/1/2025-1/31/2025 you would enter 1/1/25-2/1/25 and the data from 2/1 won't be included in the report).
- Program Name: Program options are listed in alphabetical and/or numerical order and default to All.
- Level of Care: Level of care options are listed in alphabetical and/or numerical order and default to All.
- Clinical Level of Care: Level of care options are listed in alphabetical and/or numerical order and default to All.
- Primary Therapist: Primary therapist options are listed in alphabetical and/or numerical order and default to All.
- Diet: Diet options are listed in alphabetical and/or numerical order and default to All.
- Insurance Company: Insurance company options are listed in alphabetical and/or numerical order and default to All.
- Patient Tags: Patient tag options are listed in alphabetical and/or numerical order and default to All.
- Historical Census: Data table displays the following fields:
- Full Name: Combination of the patient’s first, middle, and last name as defined on the patient’s information tab
- MR: Patient’s latest MR number as defined on the patient’s information tab
- DOB: Patient's date of birth
- Location: Location name as defined in the location profile under Settings > Company > Location
- Building: Building name as defined in the building profile under Settings > Rooms > Building
- Bed: Bed name as defined in the beds profile under Settings > Rooms > Bed
- Room: Room name as defined in the rooms profile under Settings > Rooms > Room
- Program: Program name as defined on the patient’s information tab
- Data tables: Patient’s UR level of care found in their information tab under Utilization Review
- Clinical Level of Care: The patient’s clinical level of care as displayed in the patient header. The Clinical LOC is managed within evaluations that have the field provided (i.e. Manage Clinical Level of Care form)
- Days in Census: Total calendar days from admission date through today
- Admission Date: The patient’s admission date is found on the patient’s information tab
- Anticipated Discharge Date: Date found in the patient’s information tab under ‘Anticipated Discharge Date’
- Discharge Date: The patient’s discharge date found on the patient’s information tab
Glossary
This tab includes KPI definitions and calculations.
Comments
0 comments
Article is closed for comments.