The Clinical Outcomes dashboard provides KPIs and treatment outcome details so that areas of improvement and success can be identified for a given treatment program, location, or level of care. The purpose of the Clinical Outcomes dashboard is to display discharge data for the evaluation and measurement of the care provided.
Key User Roles
Clinical directors, clinicians, clinical managers, and marketing teams may all benefit from using this dashboard.
Data Refresh Schedule
The data presented in the BI Dashboards is not updated in real time, which means there is a delay between when data is entered into the EMR and when it is viewable in the BI Dashboards. Instead, there are four scheduled BI data refreshes each work day at 3 AM, 9 AM, 1 PM, and 5 PM. There are two scheduled refresh periods on each weekend day at 3 AM and 3 PM. All times are EST.
Note: These BI data refresh periods typically last 4-6 hours and while the refresh process is uploading to the dashboards (usually the last 2 hours of the process) data may not be present or may be incomplete.
Data entered after a refresh will not be reflected in the dashboards until the following refresh is completed. When using the dashboards for analysis it is recommended to use yesterday as the most recent time period to ensure you are working with a complete data set.
Each subtab displays the date and time of the last refresh in UTC.
Clinical Outcomes Dashboard
Important: New Kipu customers need to be live for at least 30 days for data to populate. Any of the previous year and previous month KPIs will not populate until the respective amount of time has passed.
- To reach the Kipu BI tab, click on the Reports tab, then Kipu BI.
- Then select Clinical Outcomes.
General Controls
Below the tabs that include the Operations, Billing, and other options, you will find several icons.
-
Control updates:
- The circular arrow refreshes the data, while the back and forward arrows undo and redo changes respectively.
- If you click on the icon of a down arrow in a box, you will access the following drop-down list.
- Use the options provided to print the current tab or download it as a PDF file. Clicking View downloads will allow you to view all downloads created from that tab previously, and to download them again.
- You can hover over each widget to access the two indicated icons.
- Click on the two arrows to expand the widget to full screen
- Click on the three vertical dots to view summary data or export the information in the widget to CSV and/or Excel, etc..
- Hovering over widgets with charts, graphs, and other visual elements will display additional information.
-
On all tables, you can adjust the width of a column by hovering over the divider line, then clicking and dragging it to the desired size. Doing so can, in the case of some of the larger tables, help you view more columns at once.
- You can also click on the column title to change whether the column is sorted by alphabetical or reverse alphabetical order.
-
Each section has Controls, which have different defaults and purposes. However, the mechanics of each section are similar. To access the controls for each tab, simply click anywhere on the controls row.
-
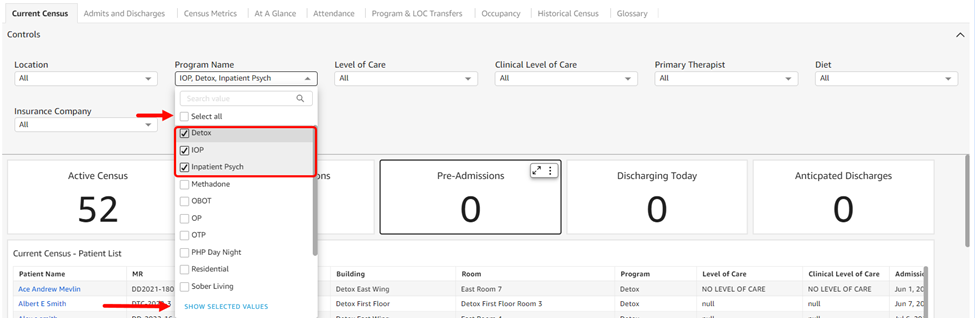
Most drop-downs contain a series of options and many default to selecting all. You can choose specific items by unchecking the Select All option and then checking off each item individually. If you click the Show Selected Values option at the bottom of the list, you will only see the items you selected.
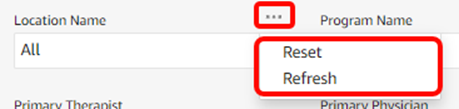
- If you hover over each drop-down, three dots appear, allowing you to access the Reset and Refresh options.
- All KPI widgets are linked to the control filters except for the ‘Previous’ and ‘Current Month/Year’ widgets. They will remain the same regardless of date range filtering.
- Current Month: 1st - current day of current month
- Previous Month: First day – last day of previous month
- Current Year: Starting on January 1st of the current year
- Previous Year: January 1st – December 31st of the previous year
-
If you click on any of the widgets in these tabs, you will access the menu for that widget.
-
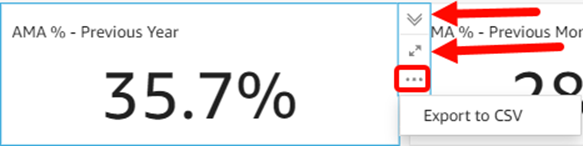
The downward arrows collapse the menu, the two arrows expand the widget to full screen, and the three dots give you export options.
-
-
In order to export the data from the Data tab, click on the white space in the header.
- The circular arrow refreshes the data, while the back and forward arrows undo and redo changes respectively.
Discharges
This section allows you to view discharge data by discharge type with a specific focus on AMA and completed discharges.
The Controls level allows you to filter your data by key dimensions and set a date range.
-
Controls default to All.
- Location Name: Locations match the locations found in the instance banner drop-down and are listed in alphabetical order.
- Program Name: Program options are listed in alphabetical and/or numerical order.
- Last Level of Care: Level of care options are listed in alphabetical and/or numerical order.
- Last Level of Care Clinical: Level of care options are listed in alphabetical and/or numerical order.
- Discharge Date: The selected date range defaults to the last 13 months and is tied to the graph trends and KPIs labeled as "Selected Date Range". Additionally, if you enter a manual date range, note that data from the end date will not be included (if you want reports on data from 1/1/2025-1/31/2025 you would enter 1/1/25-2/1/25 and the data from 2/1 won't be included in the report).
- Discharge Type: Discharge type options are listed in alphabetical and/or numerical order.
- Primary Therapist: Primary therapist options are listed in alphabetical and/or numerical order.
- Primary Physician: Primary physician options are listed in alphabetical and/or numerical order.
-
AMA?: Yes and No options.
- AMA or Discharge against medical advice is defined as a patient or program participant who chooses to be discharged from a program against the recommendation of the treating clinician.
AMA is defined as a patient or program participant who chooses to discharge from a program against the recommendation of the treating clinician. Within Kipu BI, this definition is based on the hardcoded discharge type of "left voluntarily before completing treatment (against medical, clinical or staff advice" as well as any custom discharge types used by your organization that include the following language: AMA, ACA, ATA, ASA (but not ASAM), APA, voluntary, voluntarily, against, AWOL, unsuccessfully, or premature.
Completed discharges are patients who are discharged because they successfully completed treatment. Within Kipu BI, this definition is based on the hardcoded discharge type of "completed treatment, completed episode of care," and any customized discharge types containing the following language: treatment complete, success, completion, complete, approval, approved, and WSA
- Discharges by Discharge Type – Selected Date Range: This pie chart shows total discharges per discharge type. Each discharge type is color-coded, and percent totals are displayed.
-
AMA % - Previous Year: This widget indicates what percentage of all discharges in the previous year (1/1 - 12/31) are AMA discharges.
- KPI Calculation: Total AMA Discharges / Total Discharges
-
AMA % - Previous Month: Indicates what percentage of all discharges in the previous month (first - last day) are AMA discharges.
- KPI Calculation: Total AMA Discharges / Total Discharges
-
AMA % - Current Month: Indicates what percentage of all discharges in the current month (first day - today) are AMA discharges.
- KPI Calculation: Total AMA Discharges / Total Discharges
-
AMA % - Selected Date Range: Indicates what percentage of all discharges in the selected date range are AMA discharges.
- KPI Calculation: Total AMA Discharges / Total Discharges
-
AMAs – Previous Year Total: Indicates the total number of AMA discharges in the previous year (1/1 - 12/31) are AMA discharges.
- KPI Calculation: Total AMA Discharges
-
AMAs – Previous Month: Indicates the total number of AMA discharges in the previous month (first - last day).
- KPI Calculation: Total AMA Discharges
-
AMAs – Current Month: Indicates the total number of AMA discharges in the current month (first day - today).
- KPI Calculation: Total AMA Discharges
-
AMAs – Selected Date Range: Indicates the total number of AMA discharges in the selected date range.
- KPI Calculation: Total AMA Discharges
- AMA % - Selected Date Range: Line Graph: The AMA% - Selected Date Range line graph shows the discharge rate per month and includes a trend line for the average discharge AMA rate for the date range.
- The AMA% - Selected Date Range line graph shows the discharge rate per month and includes a trend line for the average discharge AMA rate for the date range.
-
Completion % - Previous Year: Indicates what percentage of all discharges in the previous year (1/1 - 12/31) have successfully completed treatment.
- KPI Calculation: (Total completed treatment + Total completed episode of care) / Total discharges.
-
Completion % - Previous Month: Indicates what percentage of all discharges in the previous month (first - last day) have successfully completed treatment.
- KPI Calculation: (Total completed treatment + Total completed episode of care) / Total discharges
-
Completion % - Current Month: Indicates what percentage of all discharges in the current month (first day - today) have successfully completed treatment.
- KPI Calculation: (Total completed treatment + Total completed episode of care) / Total discharges
-
Completion % - Selected Date Range: Indicates what percentage of all discharges in the selected date range have successfully completed treatment.
- KPI Calculation: (Total completed treatment + Total completed episode of care) / Total discharges
-
Completions – Previous Year Total: Indicates the average number of treatment completions in the previous year (1/1 -12/31).
- KPI Calculation: Total completed treatment + Total completed episode of care
-
Completions – Previous Month: Indicates the total number of treatment completions in the previous month (first - last day).
- KPI Calculation: Total completed treatment + Total completed episode of care
-
Completions – Current Month: Indicates the total number of treatment completions in the current month (first day - today).
- KPI Calculation: Total completed treatment + Total completed episode of care
-
Completions – Selected Date Range: Indicates the total number of treatment completions in the selected date range.
- KPI Calculation: Total completed treatment + Total completed episode of care
-
Completion % - Selected Date Range
- The Completion % - Selected Date Range line graph shows the treatment completion rate per month. It includes a trend line for the average treatment completion rate for the date range.
AMA Breakdown
-
Controls default to All.
-
Location Name: Options are listed in alphabetical order and are available in accordance with the instance itself. They will match the locations found in the Kipu EMR instance banner and default to All. If you select individual locations and then click on Show Selected Values, you will see a list of only the locations you have selected.
- Program Name: Program options are listed in alphabetical and/or numerical order, and default to All.
- Last Level of Care: Level of care options are listed in alphabetical and/or numerical order.
- Last Level of Care Clinical: Level of care options are listed in alphabetical and/or numerical order.
- Discharge Date: The selected date range defaults to the last 13 months and is tied to the graph trends and KPIs labeled as "Selected Date Range". Additionally, if you enter a manual date range, note that data from the end date will not be included (if you want reports on data from 1/1/2025-1/31/2025 you would enter 1/1/25-2/1/25 and the data from 2/1 won't be included in the report).
- Discharge Type: Discharge type options are listed in alphabetical and/or numerical order.
- Primary Therapist: Primary therapist options are listed in alphabetical order and default to All.
- Primary Physician: Primary physician options are listed in alphabetical and/or numerical order.
-
AMA?: Yes and No options.
- AMA or Discharge against medical advice is defined as a patient or program participant who chooses to be discharged from a program against the recommendation of the treating clinician.
- Diagnosis Code: Filter by assigned diagnosis code or codes.
-
Location Name: Options are listed in alphabetical order and are available in accordance with the instance itself. They will match the locations found in the Kipu EMR instance banner and default to All. If you select individual locations and then click on Show Selected Values, you will see a list of only the locations you have selected.
- AMA by Program: Stacked bar graph for AMA totals per program for the selected date range.
- AMA by Clinical Level of Care: Stacked bar graph for AMA totals per clinical level of care for the selected date range.
- AMA by Level of Care: Stacked bar graph for AMA totals per UR level of care for the selected date range.
-
Total AMAs – Selected Date Range: Indicates the total number of AMA discharges in the selected date range. These discharges include patients that left voluntarily before completing treatment (against medical, clinical, or staff advice) and any customized discharge types containing the following: AMA, ACA, ATA, ASA (but not ASAM), APA, voluntary, voluntarily, against, AWOL, unsuccessfully, and premature.
- KPI Calculation: Total AMA Discharges
-
Total Discharges – Selected Date Range: Indicates the total number of discharges in the selected date range and all discharge types are included.
- KPI Calculation: Total discharges
-
AMA % - Selected Date Range: Indicates what percentage of all discharges in the selected date range are AMA discharges. These discharges include patients who left voluntarily before completing treatment (against medical, clinical, or staff advice) and any customized discharge types containing the following: AMA, ACA, ATA, ASA (but not ASAM), APA, voluntary, voluntarily, against, AWOL, unsuccessfully, and premature.
- KPI Calculation: Total AMA Discharges / Total Discharges
Re-Admits
-
Controls default to All.
-
Location/Location Name: Options are listed in alphabetical order and are available in accordance with the instance itself. They will match the locations found in the Kipu EMR instance banner and default to All. If you select individual locations and then click on Show Selected Values, you will see a list of only the locations you have selected.
- Program Name: Program options are listed in alphabetical and/or numerical order, and default to All.
- Last Level of Care: Level of care options are listed in alphabetical and/or numerical order.
- Last Level of Care Clinical: Level of care options are listed in alphabetical and/or numerical order.
- Discharge Date: The selected date range defaults to the last 13 months and is tied to the graph trends and KPIs labeled as "Selected Date Range". Additionally, if you enter a manual date range, note that data from the end date will not be included (if you want reports on data from 1/1/2025-1/31/2025 you would enter 1/1/25-2/1/25 and the data from 2/1 won't be included in the report).
- Admission Date: Defaults to all. Additionally, if you enter a manual date range, note that data from the end date will not be included (if you want reports on data from 1/1/2025-1/31/2025 you would enter 1/1/25-2/1/25 and the data from 2/1 won't be included in the report).
- Discharge Type: Discharge type options are listed in alphabetical and/or numerical order.
- Primary Therapist: Primary therapist options are listed in alphabetical order and default to All.
- Primary Physician: Primary physician options are listed in alphabetical and/or numerical order.
-
AMA?: Yes and No options.
- AMA or Discharge against medical advice is defined as a patient or program participant who chooses to be discharged from a program against the recommendation of the treating clinician.
- Diagnosis Code: Filter by assigned diagnosis code or codes.
-
Location/Location Name: Options are listed in alphabetical order and are available in accordance with the instance itself. They will match the locations found in the Kipu EMR instance banner and default to All. If you select individual locations and then click on Show Selected Values, you will see a list of only the locations you have selected.
-
Re-Admit % - Previous Year Average: Indicates the average number of readmissions in the previous year (1/1 -12/31).
- KPI Calculation: Total readmissions / Total discharges
-
Re-Admit % - Previous Month: Indicates the readmission rate for the previous month (first - last day).
- KPI Calculation: Total readmissions / Total discharges
-
Re-Admit % - Current Month: Indicates the readmission rate in the current month (first day -today).
- KPI Calculation: Total readmissions / Total discharges
-
Re-Admit % - Selected Date Range: Indicates the readmission rate for the selected date range.
- KPI Calculation: Total readmissions / Total discharges
-
Re-Admits – Previous Year Total: Indicates the average number of readmissions in the previous year (1/1 – 12/31).
- KPI Calculation: Total readmissions
-
Re-Admits – Previous Month: Indicates the total number of readmissions in the previous month (first - last day).
- KPI Calculation: Total readmissions
-
Re-Admits – Current Month: Indicates the total number of readmissions in the current month (first – today).
- KPI Calculation: Total readmissions
-
Re-Admits – Selected Date Range: Indicates the total number of readmissions in the selected date range
- KPI Calculation: Total readmissions
- Re-Admit % - Selected Date Range: The line graph for the re-admission rate per month includes a trend line for the average re-admission rate for the selected date range.
- Re-Admits – Selected Date Range: The re-admits bar graph for the re-admission rate per month includes a trend line for average readmissions for the selected date range.
Total LOS
-
Controls default to All.
-
Location Name: Options are listed in alphabetical order and are available in accordance with the instance itself. They will match the locations found in the Kipu EMR instance banner and default to All. If you select individual locations and then click on Show Selected Values, you will see a list of only the locations you have selected.
- Program Name: Program options are listed in alphabetical and/or numerical order, and default to All.
- Last Level of Care: Level of care options are listed in alphabetical and/or numerical order.
- Last Level of Care Clinical: Level of care options are listed in alphabetical and/or numerical order.
- Discharge Date: The selected date range defaults to the last 13 months and is tied to the graph trends and KPIs labeled as "Selected Date Range". Additionally, if you enter a manual date range, note that data from the end date will not be included (if you want reports on data from 1/1/2025-1/31/2025 you would enter 1/1/25-2/1/25 and the data from 2/1 won't be included in the report).
- Discharge Type: Discharge type options are listed in alphabetical and/or numerical order.
- Primary Therapist: Primary therapist options are listed in alphabetical order and default to All.
- Primary Physician: Primary physician options are listed in alphabetical and/or numerical order.
-
AMA?: Yes and No options.
- AMA or Discharge against medical advice is defined as a patient or program participant who chooses to be discharged from a program against the recommendation of the treating clinician.
- Diagnosis Code: Filter by assigned diagnosis code or codes.
-
Location Name: Options are listed in alphabetical order and are available in accordance with the instance itself. They will match the locations found in the Kipu EMR instance banner and default to All. If you select individual locations and then click on Show Selected Values, you will see a list of only the locations you have selected.
-
Total LOS – Previous Year Average: Indicates the average length of stay for the whole previous year.
- KPI Calculation: Sum of total length of stay / Total discharges
-
Total LOS – Previous Month Average: Indicates the average length of stay for the previous month (first - last day).
- KPI Calculation: Sum of total length of stay / Total discharges
-
Total LOS – Current Month Average: Indicates the average length of stay in the current month (first - today).
- KPI Calculation: Sum of total length of stay / Total discharges
-
Total LOS – Selected Date Range Average: Indicates the average length of stay for the selected date range.
- KPI Calculation: Sum of total length of stay / Total discharges
- Length of Stay – Selected Date Range: Line graph for total length of stay per month which includes a trend line to indicate the average length of stay for the selected date range.
LOS by Program
-
Controls default to All.
-
Location: Options are listed in alphabetical order and are available in accordance with the instance itself. They will match the locations found in the Kipu EMR instance banner and default to All. If you select individual locations and then click on Show Selected Values, you will see a list of only the locations you have selected.
- Program: Program options are listed in alphabetical and/or numerical order.
- Discharge Date: The selected date range defaults to the last 13 months and is tied to the graph trends and KPIs labeled as "Selected Date Range". Additionally, if you enter a manual date range, note that data from the end date will not be included (if you want reports on data from 1/1/2025-1/31/2025 you would enter 1/1/25-2/1/25 and the data from 2/1 won't be included in the report).
- Discharge Type: Discharge type options are listed in alphabetical and/or numerical order.
- Primary Therapist: Primary therapist options are listed in alphabetical order.
-
AMA?: Yes and No options.
- AMA or Discharge against medical advice is defined as a patient or program participant who chooses to be discharged from a program against the recommendation of the treating clinician.
- Patient Name: Filter by patient name.
- Payment Method: Filter by payment method.
- Insurance: Insurance options listed in alphabetical order in a multi-select drop-down with checkboxes.
- Diagnosis Code: Filter by assigned diagnosis code or codes.
-
Location: Options are listed in alphabetical order and are available in accordance with the instance itself. They will match the locations found in the Kipu EMR instance banner and default to All. If you select individual locations and then click on Show Selected Values, you will see a list of only the locations you have selected.
- LOS – Previous Year Average: Stacked bar graph for previous year (1/1 - 12/31) average length of stay per program.
- LOS – Previous Month: Stacked bar graph for average length of stay per program for the previous month.
- LOS – Current Month: Stacked bar graph for average length of stay per program in the current month (first day - today).
- LOS – Selected Date Range: Stacked bar graph for average length of stay per program in the selected date range.
LOS by LOC
-
Controls default to All.
-
Location: Options are listed in alphabetical order and are available in accordance with the instance itself. They will match the locations found in the Kipu EMR instance banner and default to All. If you select individual locations and then click on Show Selected Values, you will see a list of only the locations you have selected.
- Program: Program options are listed in alphabetical and/or numerical order.
- Discharge Date: The selected date range defaults to the last 13 months and is tied to the graph trends and KPIs labeled as "Selected Date Range". Additionally, if you enter a manual date range, note that data from the end date will not be included (if you want reports on data from 1/1/2025-1/31/2025 you would enter 1/1/25-2/1/25 and the data from 2/1 won't be included in the report).
- Discharge Type: Discharge type options are listed in alphabetical and/or numerical order.
- Primary Therapist: Primary therapist options are listed in alphabetical order.
-
AMA?: Yes and No options.
- AMA or Discharge against medical advice is defined as a patient or program participant who chooses to be discharged from a program against the recommendation of the treating clinician.
- Patient Name: Filter by patient name.
- Payment Method: Filter by payment method.
- Insurance: Insurance options listed in alphabetical order in a multi-select drop-down with checkboxes.
- Diagnosis Code: Filter by assigned diagnosis code or codes.
-
Location: Options are listed in alphabetical order and are available in accordance with the instance itself. They will match the locations found in the Kipu EMR instance banner and default to All. If you select individual locations and then click on Show Selected Values, you will see a list of only the locations you have selected.
- LOS – Previous Year Average: Stacked bar graph for the previous year (1/1 - 12/31) average length of stay per UR level of care.
- LOS – Previous Month: Stacked bar graph for the average length of stay per UR level of care for the previous month.
- LOS – Current Month: Stacked bar graph for the average length of stay per UR level of care in the current month (first day - today).
- LOS – Selected Date Range: Stacked bar graph for the average length of stay per UR level of care for the selected date range.
LOS by Clinical LOC
-
Controls default to All.
-
Location: Options are listed in alphabetical order and are available in accordance with the instance itself. They will match the locations found in the Kipu EMR instance banner and default to All. If you select individual locations and then click on Show Selected Values, you will see a list of only the locations you have selected.
- Discharge Date: The selected date range defaults to the last 13 months and is tied to the graph trends and KPIs labeled as "Selected Date Range". Additionally, if you enter a manual date range, note that data from the end date will not be included (if you want reports on data from 1/1/2025-1/31/2025 you would enter 1/1/25-2/1/25 and the data from 2/1 won't be included in the report).
- Discharge Type: Discharge type options are listed in alphabetical and/or numerical order.
- Primary Therapist: Primary therapist options are listed in alphabetical order and default to All.
-
AMA?: Yes and No options.
- AMA or Discharge against medical advice is defined as a patient or program participant who chooses to be discharged from a program against the recommendation of the treating clinician.
- Patient Name: Patient options are listed in alphabetical order.
- Payment Method: Payment method options are listed in alphabetical order.
- Diagnosis Code: Filter results by diagnosis code.
-
Location: Options are listed in alphabetical order and are available in accordance with the instance itself. They will match the locations found in the Kipu EMR instance banner and default to All. If you select individual locations and then click on Show Selected Values, you will see a list of only the locations you have selected.
- LOS – Previous Year Average: Stacked bar graph for previous year (1/1 - 12/31) average length of stay per clinical level of care.
- LOS – Previous Month: Stacked bar graph for average length of stay per clinical level of care for the previous month.
- LOS – Current Month: Stacked bar graph for average length of stay per clinical level of care in the current month (first day - today).
- LOS – Selected Date Range: Stacked bar graph for average length of stay per clinical level of care in the selected date range.
Data Tab
-
Controls default to All.
-
Location Name: Options are listed in alphabetical order and are available in accordance with the instance itself. They will match the locations found in the Kipu EMR instance banner and default to All. If you select individual locations and then click on Show Selected Values, you will see a list of only the locations you have selected.
- Program Name: Program options are listed in alphabetical and/or numerical order.
-
Last Level of Care: Level of care options are listed in alphabetical and/or numerical order.
- Last Level of Care Clinical: Level of care options are listed in alphabetical and/or numerical order.
-
Admission Date: The date range defaults to the last 12 months and is tied to graph trends and any KPIs labeled Selected Date Range.
- Important: Previous year, previous month, and current month KPIs will not update upon modification of the date range because they are hard coded. Additionally, if you enter a manual date range, note that data from the end date will not be included (if you want reports on data from 1/1/2025-1/31/2025 you would enter 1/1/25-2/1/25 and the data from 2/1 won't be included in the report).
- Discharge Date: The selected date range defaults to the last 13 months and is tied to the graph trends and KPIs labeled as "Selected Date Range". Additionally, if you enter a manual date range, note that data from the end date will not be included (if you want reports on data from 1/1/2025-1/31/2025 you would enter 1/1/25-2/1/25 and the data from 2/1 won't be included in the report).
- Discharge Type: Discharge type options are listed in alphabetical and/or numerical order.
- Primary Therapist: Primary therapist options are listed in alphabetical order.
- Primary Physician: Primary physician options are listed in alphabetical and/or numerical order.
-
AMA?: Yes and No options.
- AMA or Discharge against medical advice is defined as a patient or program participant who chooses to be discharged from a program against the recommendation of the treating clinician.
- Diagnosis Code: Filter by assigned diagnosis code or codes.
-
Location Name: Options are listed in alphabetical order and are available in accordance with the instance itself. They will match the locations found in the Kipu EMR instance banner and default to All. If you select individual locations and then click on Show Selected Values, you will see a list of only the locations you have selected.
- Patient Full Name: Combination of the patient’s first, middle, and last name as defined on the patient’s information tab.
- MR: Patient’s MR number as defined on the patient’s information tab.
- Location Name: Location name as defined in the location profile under ‘Settings’ > ‘Company’ > ‘Location’.
- Program Name: Patient information tab
- Last Level of Clinical Care: Patient’s clinical level of care upon discharge is displayed in the patient header. The Clinical LOC is managed within evaluations that have the field provided (i.e., Manage Clinical Level of Care form).
- Last Level of Care: Patient’s level of care upon discharge found in the patient’s information tab under ‘Utilization Review’ (UR level of care).
- Discharge Date: Patient’s discharge date found on the patient’s information tab.
- Discharge Type: Patient’s discharge type defined on an evaluation template in the ‘Discharge Type’ field. The values in the ‘Discharge Type’ field drop-down are defined by the discharge types enabled in Settings.
- Primary Therapist: Kipu user with the role of Primary Therapist attached to the patient record via an evaluation template. In an evaluation template, there is an ‘Assignment of Care Team’ field.
- Primary Physician: Kipu user with the role of Doctor attached to the client's record via an evaluation template. In an evaluation template, there is an ‘Assignment of Care Team’ field.
- LOS (calculated field): Difference in days between admission and discharge date.
-
AMA Flag: Discharged AMA is determined from the discharge type selected for the patient within an evaluation template.
- 1 is true for if a patient discharged AMA
- 0 is false for if a patient discharged AMA
-
Is Readmit: Readmission is determined by if a patient returns to a facility and when. If they return within 90 days of discharge, they are considered a readmit.
- 1 is true for if a patient is a readmit
- 0 is false for if a patient is a readmit
-
Completion: Treatment completion is determined by the discharge type selected for the patient within an evaluation template.
- 1 is true for if a patient completed treatment
- 0 is false for if a patient completed treatment
Outcomes Measures
The Outcomes Measures tab allows users to view outcomes issue score averages for patients who have discharged AMA to better understand what areas (if any) need to be improved to lower the risk of AMA. It also provides data that allows users to see what areas patients are scoring well in, which can lead to treatment completion.
-
Controls default to All.
-
Location: Options are listed in alphabetical order and are available in accordance with the instance itself. They will match the locations found in the Kipu EMR instance banner and default to All. If you select individual locations and then click on Show Selected Values, you will see a list of only the locations you have selected.
- Program: Program options are listed in alphabetical and/or numerical order.
- Assessment Date: Filter assessments by date of completion. Additionally, if you enter a manual date range, note that data from the end date will not be included (if you want reports on data from 1/1/2025-1/31/2025 you would enter 1/1/25-2/1/25 and the data from 2/1 won't be included in the report).
- Discharge Type: Discharge type options are listed in alphabetical and/or numerical order.
- Primary Physician: Primary physician options are listed in alphabetical and/or numerical order.
- Primary Therapist: Primary therapist options are listed in alphabetical order.
- Assessment Name: Filter assessments by name.
- In Current Census: The Current Census options are Yes and No, and default to Yes.
- Full Name: Filter by the patient's full name.
- Assessment Issue: Assessment Issue options are listed in alphabetical order.
- Discharge Date: The selected date range defaults to the last 13 months and is tied to the graph trends and KPIs labeled as "Selected Date Range". Additionally, if you enter a manual date range, note that data from the end date will not be included (if you want reports on data from 1/1/2025-1/31/2025 you would enter 1/1/25-2/1/25 and the data from 2/1 won't be included in the report).
- Insurance Company: Insurance company options are listed in alphabetical order.
-
Location: Options are listed in alphabetical order and are available in accordance with the instance itself. They will match the locations found in the Kipu EMR instance banner and default to All. If you select individual locations and then click on Show Selected Values, you will see a list of only the locations you have selected.
- Total Assessments by Month: Line graph for total assessment count per month
-
Average Total Score By Assessment: Line graph for average total assessment score per assessment by assessment month. The average total score equals the total score for the assessment divided by the number of assessment occurrences.
- Separate lines are designated for each assessment differentiated by color.
-
Average Score Issue - AMA Comparison: Line graph for comparing patients' average issue score to whether they were discharged AMA. The average issue score equals the total score for the issue divided by the number of issue occurrences.
-
Separate lines designated for treatment completion and for non-completion are differentiated by color.
-
-
Average Issue Score - Completed Treatment Comparison: Line graph for comparing patients' average issue score to whether they were discharged AMA. The average issue score equals the total score for the issue divided by the number of issue occurrences.
-
Separate lines designated for treatment completion and for non-completion are differentiated by color.
-
- Top Issues for AMA Patients: Horizontal bar graph for top issues for patients who discharge AMA. The average issue score equals the total score for the issue divided by the number of issue occurrences.
- Top Issues for Patients Who Completed Treatment: Horizontal bar graph for top issues for patients who complete treatment. The average issue score equals the total score for the issue divided by the number of issue occurrences.
- Average Issue Score by Occurrence: Data table to show the total number of assessment occurrences for each issue assessment, and the average issue score by occurrence for each assessment.
-
Data Tab - Assessment Total Score: Data table containing the details of each assessment occurrence.
- Location: Location name as defined in the location profile under Settings > Company > Location.
- Program: The name of the program in which the patient is enrolled.
- Full Name: Combination of the patient’s first, middle, and last name as defined on the patient’s information tab
- Insurance Company: The patient's insurance company.
- MR: Patient’s MR number as defined on the patient’s information tab
- Admission Date: The date on which the patient was admitted.
- Discharge Date: The date on which the patient was discharged.
- Assessment Date: Assessment completion date as date/timestamped on the outcomes assessment for the completed status line item
- Assessment Name: Name of assessment added to a patient’s record.
- Assessment Occurrence: Number of times the assessment has occurred.
- Total Score: Total score on the assessment which includes the sum of each individual issue score
- Primary Therapist: Kipu user with the role of Primary Therapist attached to the patient record via an evaluation template. In an evaluation template, there is an ‘Assignment of Care Team’ field.
- Primary Physician: Kipu user with the role of Doctor attached to the client's record via an evaluation template. In an evaluation template, there is an ‘Assignment of Care Team’ field.
-
AMA: AMA is determined by the discharge type selected for the patient within an evaluation template.
- Yes: The patient discharged AMA
- No: The patient did not discharge AMA
-
Completed Treatment: Treatment completion is determined by the discharge type selected for the patient within an evaluation template.
- Yes: The patient completed treatment
- No: The patient did not complete treatment
-
Data Tab - Outcome Issue Score: Data table containing the details of each assessment outcome.
- Location: Location name as defined in the location profile under Settings > Company > Location.
- Program: The name of the program in which the patient is enrolled.
- Full Name: Combination of the patient’s first, middle, and last name as defined on the patient’s information tab
- Insurance Company: The patient's insurance company.
- MR: Patient’s MR number as defined on the patient’s information tab
- Admission Date: The date on which the patient was admitted.
- Discharge Date: The date on which the patient was discharged.
- Assessment Date: Assessment completion date as date/timestamped on the outcomes assessment for the completed status line item
- Assessment Name: Name of assessment added to a patient’s record
- Assessment Occurrence: Number of times the assessment has occurred
- Total Score: Total score on the assessment which includes the sum of each individual issue score
- Issue Name: Name of the issue
- Issue Score: The score given to the patient for that issue
- Primary Therapist: Kipu user with the role of Primary Therapist attached to the patient record via an evaluation template. In an evaluation template, there is an ‘Assignment of Care Team’ field.
- Primary Physician: Kipu user with the role of Doctor attached to the client's record via an evaluation template. In an evaluation template, there is an ‘Assignment of Care Team’ field.
-
AMA: AMA is determined by the discharge type selected for the patient within an evaluation template.
- Yes: The patient discharged AMA
- No: The patient did not discharge AMA
-
Completed Treatment: Treatment completion is determined by the discharge type selected for the patient within an evaluation template.
- Yes: The patient completed treatment
- No: The patient did not complete treatment
- Created Date for Question Table: Click on the All drop-down to set the date perimeters for the question table.
- Assessment Name for Questions Tab: Click on the drop-down to choose the questions you wish to appear on the question table.
- Aggregated Question and Answers: This table displays all questions and answers from selected Outcome Assessments during the specified time range.
Patient Demographics
-
Controls default to All.
-
Location: Options are listed in alphabetical order and are available in accordance with the instance itself. They will match the locations found in the Kipu EMR instance banner and default to All. If you select individual locations and then click on Show Selected Values, you will see a list of only the locations you have selected.
- Discharge Type: Discharge type options are listed in alphabetical and/or numerical order.
- State of Residence: Filter by the patient's state of residence.
- Insurance Company: Insurance company options are listed in alphabetical order.
- Admission Date: Defaults to all. Additionally, if you enter a manual date range, note that data from the end date will not be included (if you want reports on data from 1/1/2025-1/31/2025 you would enter 1/1/25-2/1/25 and the data from 2/1 won't be included in the report).
- Discharge Date: The selected date range defaults to the last 13 months and is tied to the graph trends and KPIs labeled as "Selected Date Range". Additionally, if you enter a manual date range, note that data from the end date will not be included (if you want reports on data from 1/1/2025-1/31/2025 you would enter 1/1/25-2/1/25 and the data from 2/1 won't be included in the report).
-
Location: Options are listed in alphabetical order and are available in accordance with the instance itself. They will match the locations found in the Kipu EMR instance banner and default to All. If you select individual locations and then click on Show Selected Values, you will see a list of only the locations you have selected.
- Ethnicity: This chart shows the breakdown of ethnicities listed on the patients' facesheets.
- Race: This chart shows the breakdown of races as listed on the patients' facesheets.
- Preferred Language: This chart shows the breakdown of preferred languages as listed on the patients' facesheets.
- Birth Sex: This chart shows the breakdown of birth sexes as listed on the patients' facesheets.
- Pronouns: This chart shows the breakdown of pronouns as listed on the patients' facesheets.
- Gender Identity: This chart shows the breakdown of gender identities as listed on the patients' facesheets.
- AMA by Category: Displays split of Patients who did or did not AMA based on category
- Successful Treatment by Category: Displays split of patients who did or did not complete treatment based on category
- Patients by Zip Code: Shows patients on a map based on ZIP codes pulled from the patient's current address in the facesheet.
-
Data Table: This data table shows all patient demographic information.
- Location: Location name as defined in the location profile under Settings > Company > Location
- Full Name: The patient’s first, middle, and last name as defined on their factsheet
- MR: Patient’s MR number as defined on the patient’s facesheet
- Admission Date: As found on the patient's facesheet
- Discharge Date: As found on the patient's facesheet
- Discharge Type: The patient’s discharge type is defined on an evaluation template in the Discharge Type field. The values in the Discharge Type field drop-down are defined by the discharge types enabled in Settings.
- Ethnicity: As defined on the patient's facesheet
- Race: As defined on the patient’s facesheet
- Preferred Language: As defined on the patient’s facesheet
- Birth Sex: As defined on the patient’s facesheet
- Gender Identity: As defined on the patient’s facesheet
- Pronouns: As defined on the patient’s facesheet
- State: As defined on the patient’s facesheet
- Zipcode: As defined on the patient’s facesheet
- Age: As defined on the patient’s facesheet
- AMA: Discharged AMA is determined by the discharge type selected for the patient in an evaluation template
- Successful Treatment: Successful treatment is determined by the discharge type selected for the patient within an evaluation template
Glossary
Contains a glossary of terms, and links to this page.
Comments
0 comments
Please sign in to leave a comment.