The Stats Report provides percentages and totals for any of the selected data fields. We recommend choosing fields that are shared across patients like gender or insurance company rather than specific fields like email address or admission date and time.
How to Create a Stats Report
Super Admins, Records Admins, and users with Manage Reports feature can build the following report:
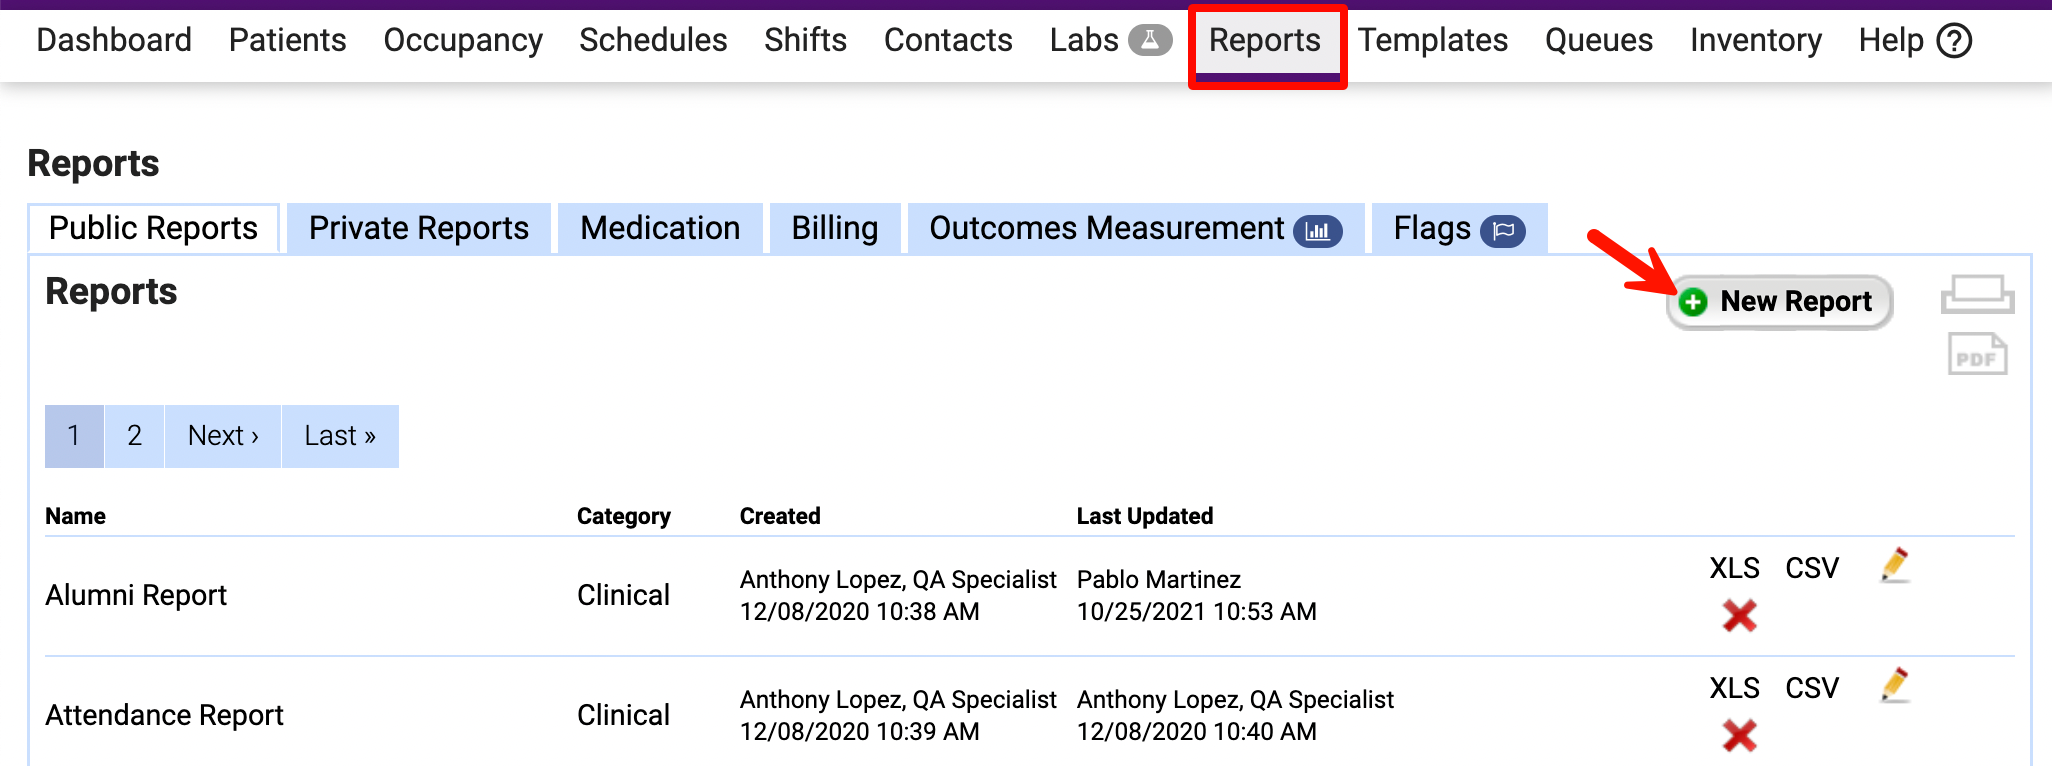
- Open the Reports tab and click New Report.
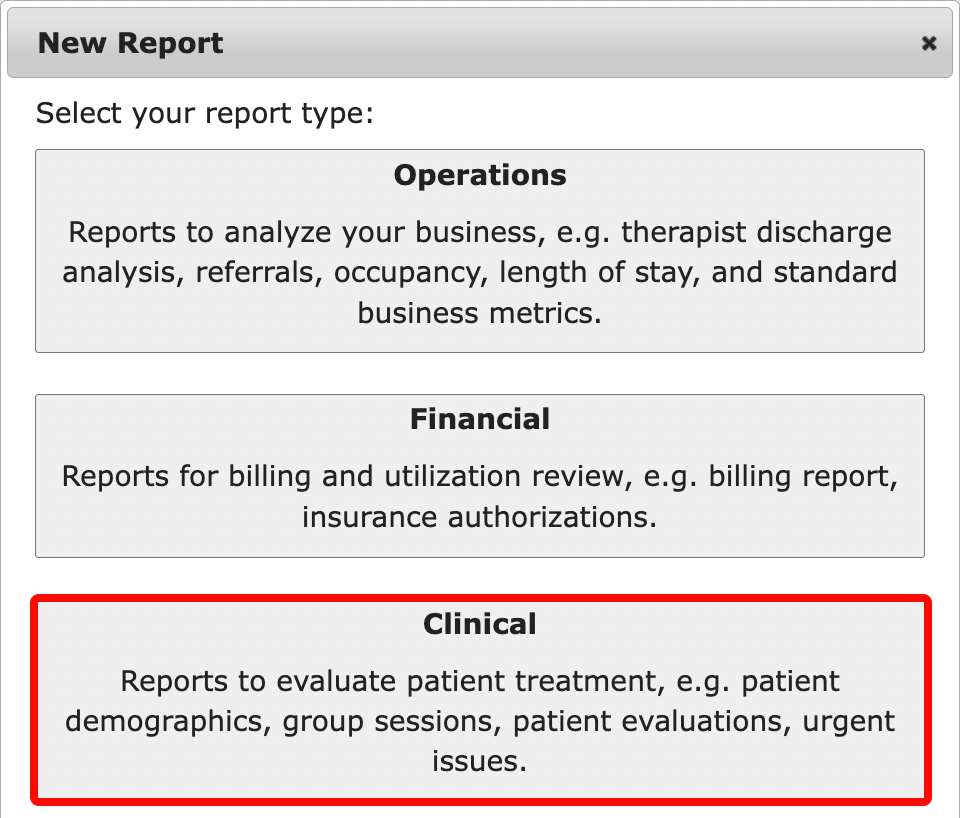
- Select Clinical for the report type.
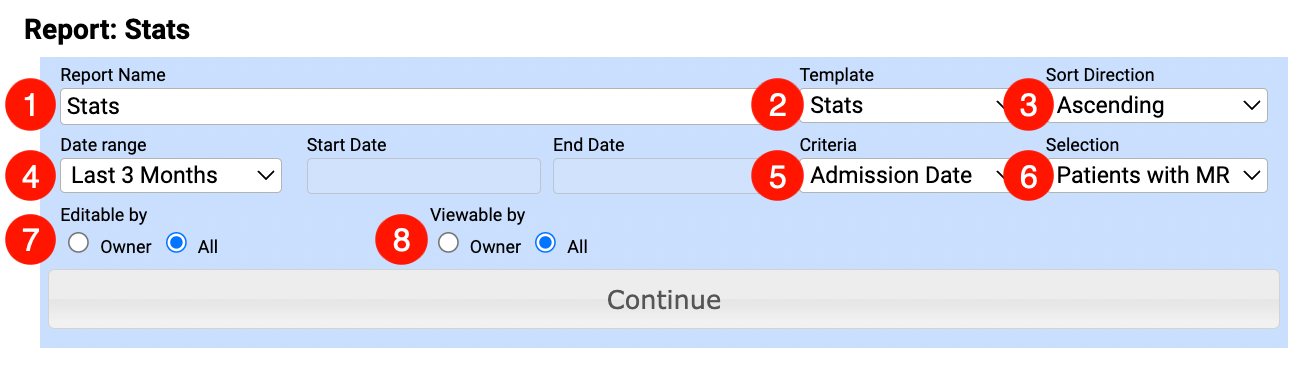
- Enter your reporting parameters.
-
- Report Name
- Template: Select Stats.
- Sort Direction: Select Ascending or Descending for the report order.
- Date Range: Select a date range for this report. Start Date/End Date is only available when a Custom date range is selected.
- Criteria: Use this drop-down to determine which patients are included in the report based on the date range selected.
- Admission Date: Pulls stats from charts admitted in the specified date range.
- Discharge Date: Pulls stats from charts discharged in the specified date range.
- Census: Pulls status from the charts that were in the census in the specified date range.
- Pre Admission: Pulls stats based on the charts that were in pre-admission status during the specified date range.
- Updated At: Pulls stats based on the charts that were updated within the specified date range.
- Expected Patients: Pulls data from patients who are expected in the facility for the date range based on the scheduled days on their insurance authorization.
- Selection: Choose to include Patients with MR (admitted), Patients without MR (not admitted), or All Patients.
- Determine who can edit the report using the Editable by radio buttons.
- All: The report can be edited by any user who has access to it.
- Owner: The report can be edited by the report's creator or a Super Admin that has a direct URL to the report.
- Identify who can view the report using the Viewable by radio buttons.
- All: The report is available under Public Reports for all users who have access to Reports.
- Owner: The report is available under Private Reports for the current user, or by using the direct URL.
- Click Continue to select which fields to include in your report.
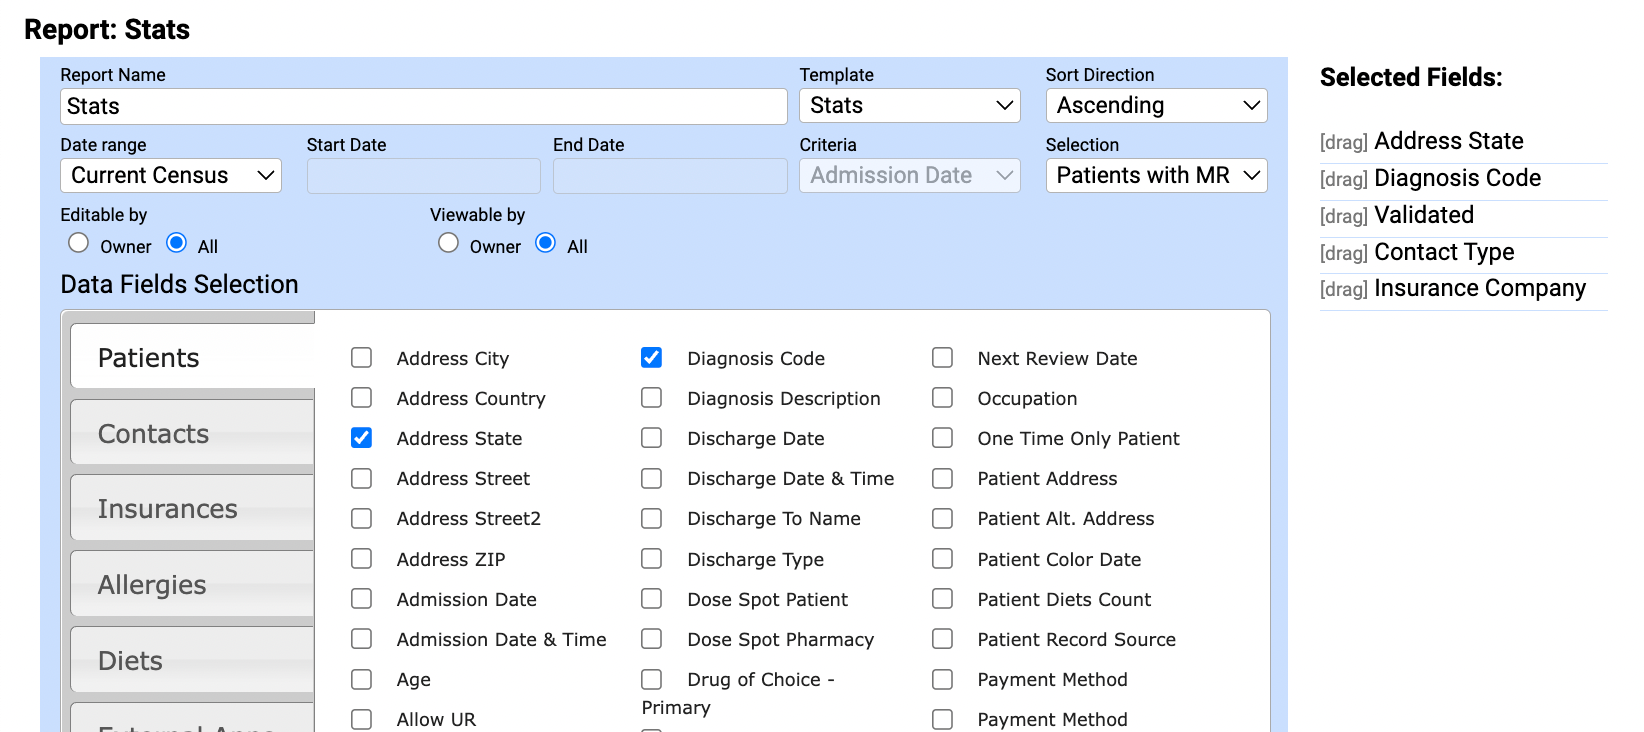
- From the Data Fields Selection, include fields that you'd like to see as a percent and total. Remember, this report works better for shared fields like Diagnosis Code versus more individual fields like Employer Name.
- Click Run Report to view your results.
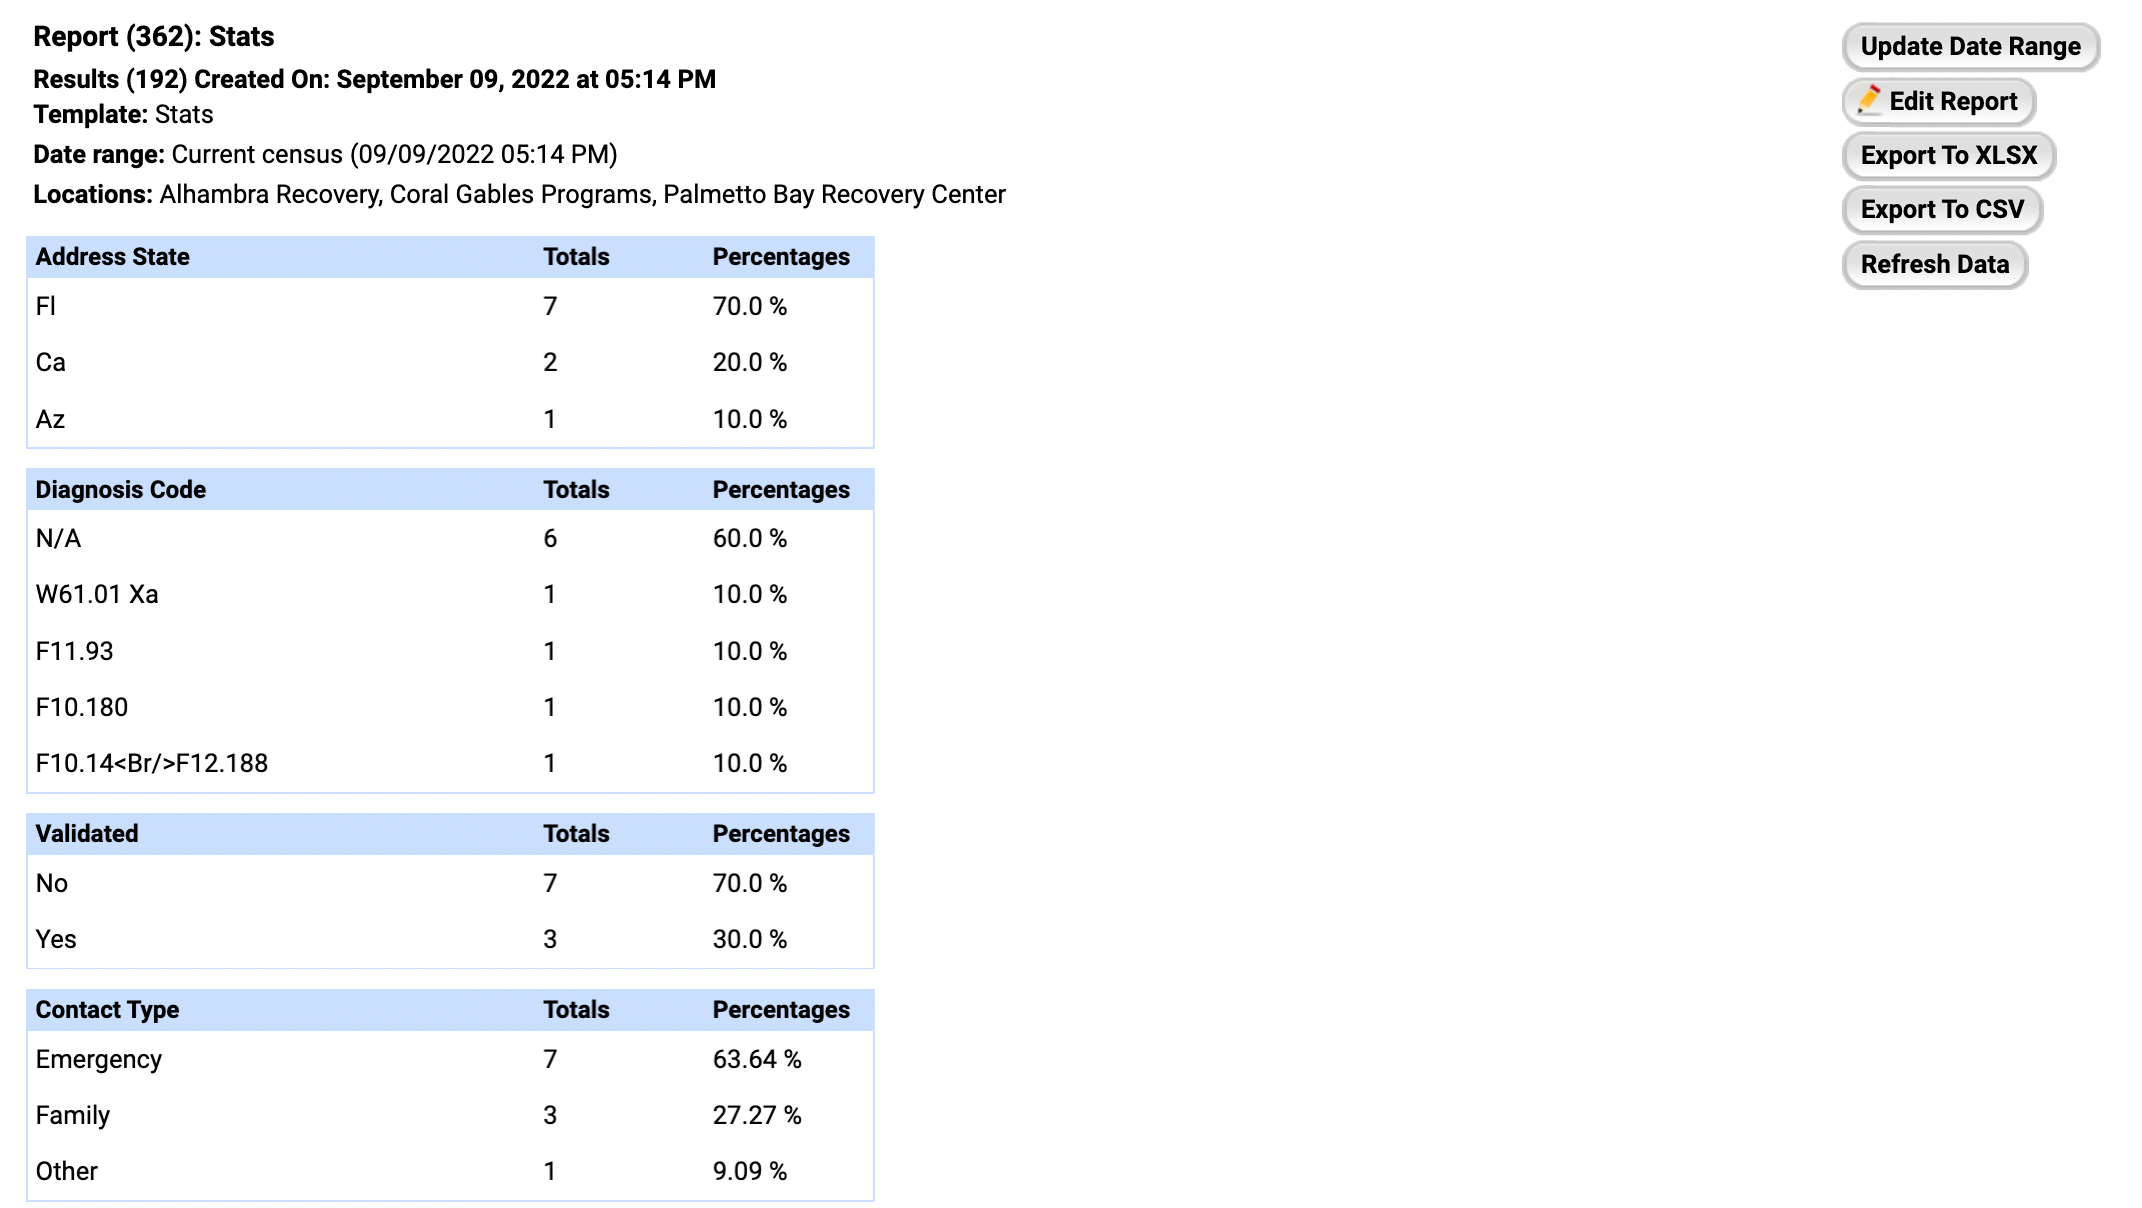
- From here, you can edit or export the report for further manipulation.
Comments
0 comments
Article is closed for comments.